Citibank 2010 Annual Report Download - page 49
Download and view the complete annual report
Please find page 49 of the 2010 Citibank annual report below. You can navigate through the pages in the report by either clicking on the pages listed below, or by using the keyword search tool below to find specific information within the annual report.-
 1
1 -
2
-
3
-
4
-
5
-
6
-
7
-
8
-
9
-
10
-
11
-
12
-
13
-
14
-
15
-
16
-
17
-
18
-
19
-
20
-
21
-
22
-
23
-
24
-
25
-
26
-
27
-
28
-
29
-
30
-
31
-
32
-
33
-
34
-
35
-
36
-
37
-
38
-
 39
39 -
 40
40 -
 41
41 -
 42
42 -
 43
43 -
 44
44 -
 45
45 -
 46
46 -
 47
47 -
 48
48 -
 49
49 -
 50
50 -
 51
51 -
 52
52 -
 53
53 -
 54
54 -
 55
55 -
 56
56 -
 57
57 -
 58
58 -
 59
59 -
60
-
61
-
62
-
63
-
64
-
65
-
66
-
67
-
68
-
69
-
70
-
71
-
72
-
73
-
74
-
75
-
76
-
77
-
78
-
79
-
80
-
81
-
82
-
83
-
84
-
85
-
86
-
87
-
88
-
89
-
90
-
91
-
92
-
93
-
94
-
95
-
96
-
97
-
98
-
99
-
100
-
101
-
102
-
103
-
104
-
105
-
106
-
107
-
108
-
109
-
110
-
111
-
112
-
113
-
114
-
115
-
116
-
117
-
118
-
119
-
120
-
121
-
122
-
123
-
124
-
125
-
126
-
127
-
128
-
129
-
130
-
131
-
132
-
133
-
134
-
135
-
136
-
137
-
138
-
139
-
140
-
141
-
142
-
143
-
144
-
145
-
146
-
147
-
148
-
149
-
150
-
151
-
152
-
153
-
154
-
155
-
156
-
157
-
158
-
159
-
160
-
161
-
162
-
163
-
164
-
165
-
166
-
167
-
168
-
169
-
170
-
171
-
172
-
173
-
174
-
175
-
176
-
177
-
178
-
179
-
180
-
181
-
182
-
183
-
184
-
185
-
186
-
187
-
188
-
189
-
190
-
191
-
192
-
193
-
194
-
195
-
196
-
197
-
198
-
199
-
200
-
201
-
202
-
203
-
204
-
205
-
206
-
207
-
208
-
209
-
210
-
211
-
212
-
213
-
214
-
215
-
216
-
217
-
218
-
219
-
220
-
221
-
222
-
223
-
224
-
225
-
226
-
227
-
228
-
229
-
230
-
231
-
232
-
233
-
234
-
235
-
236
-
237
-
238
-
239
-
240
-
241
-
242
-
243
-
244
-
245
-
246
-
247
-
248
-
249
-
250
-
251
-
252
-
253
-
254
-
255
-
256
-
257
-
258
-
259
-
260
-
261
-
262
-
263
-
264
-
265
-
266
-
267
-
268
-
269
-
270
-
271
-
272
-
273
-
274
-
275
-
276
-
277
-
278
-
279
-
280
-
281
-
282
-
283
-
284
-
285
-
286
-
287
-
288
-
289
-
290
-
291
-
292
-
293
-
294
-
295
-
296
-
297
-
298
-
299
-
300
-
301
-
302
-
303
-
304
-
305
-
306
-
307
-
308
-
309
-
310
-
311
-
312
 |
 |

47
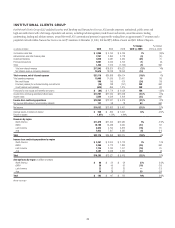
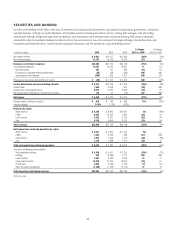
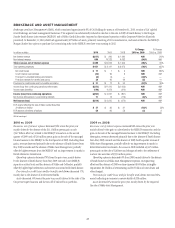
BROKERAGE AND ASSET MANAGEMENT
Brokerage and Asset Management (BAM), which constituted approximately 8% of Citi Holdings by assets as of December 31, 2010, consists of Citi’s global
retail brokerage and asset management businesses. This segment was substantially reduced in size due to the sale in 2009 of Smith Barney to the Morgan
Stanley Smith Barney joint venture (MSSB JV) and of Nikko Cordial Securities (reported as discontinued operations within Corporate/Other for all periods
presented). At December 31, 2010, BAM had approximately $27 billion of assets, primarily consisting of Citi’s investment in, and assets related to, the MSSB JV.
Morgan Stanley has options to purchase Citi’s remaining stake in the MSSB JV over three years starting in 2012.
In millions of dollars 2010 2009 2008
% Change
2010 vs. 2009
% Change
2009 vs. 2008
Net interest revenue $(277) $ 390 $ 1,280 NM (70)%
Non-interest revenue 886 14,233 6,683 (94)% NM
Total revenues, net of interest expense $ 609 $14,623 $ 7,963 (96)% 84%
Total operating expenses $ 951 $ 3,141 $ 8,973 (70)% (65)%
Net credit losses $ 17 $ 1 $ 9 NM (89)%
Credit reserve build (release) (18) 36 8 NM NM
Provision for unfunded lending commitments (6) (5) — (20)% —
Provision (release) for benefits and claims 38 40 36 (5) 11
Provisions for credit losses and for benefits and claims $ 31 $ 72 $ 53 (57)% 36%
Income (loss) from continuing operations before taxes $(373) $11,410 $(1,063) NM NM
Income taxes (benefits) (170) 4,473 (212) NM NM
Income (loss) from continuing operations $(203) $ 6,937 $ (851) NM NM
Net income attributable to noncontrolling interests 11 12 (179) (8)% NM
Net income (loss) $(214) $ 6,925 $ (672) NM NM
EOP assets reflecting the sale of Nikko Cordial Securities
(in billions of dollars) $ 27 $ 30 $ 31 (10)% (3)%
EOP deposits (in billions of dollars) 58 60 58 (3) 3
NM Not meaningful
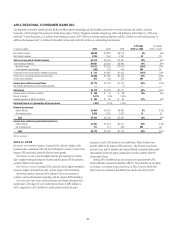
2010 vs. 2009
Revenues, net of interest expense decreased 96% versus the prior year
mainly driven by the absence of the $11.1 billion pretax gain on sale
($6.7 billion after tax) related to the MSSB JV transaction in the second
quarter of 2009 and a $320 million pretax gain on the sale of the managed
futures business to the MSSB JV in the third quarter of 2009. Excluding these
gains, revenue decreased primarily due to the absence of Smith Barney from
May 2009 onwards and the absence of Nikko Asset Management, partially
offset by higher revenues from the MSSB JV and an improvement in marks in
Retail Alternative Investments.
Operating expenses decreased 70% from the prior year, mainly driven
by the absence of Smith Barney from May 2009 onwards, lower MSSB JV
separation-related costs and the absence of Nikko and Colfondos, partially
offset by higher legal settlements and reserves associated with Smith Barney.
Provisions for credit losses and for benefits and claims decreased 57%,
mainly due to the absence of credit reserve builds.
Assets decreased 10% versus the prior year, mostly driven by the sales of the
Citi private equity business and the run-off of tailored loan portfolios.
2009 vs. 2008
Revenues, net of interest expense increased 84% versus the prior year
mainly driven by the gain on sale related to the MSSB JV transaction and the
gain on the sale of the managed futures business to the MSSB JV. Excluding
these gains, revenue decreased primarily due to the absence of Smith Barney
from May 2009 onwards and the absence of 2009 fourth-quarter revenue of
Nikko Asset Management, partially offset by an improvement in marks in
Retail Alternative Investments. Revenues in 2008 included a $347 million
pretax gain on the sale of CitiStreet and charges related to the settlement of
auction rate securities of $393 million pretax.
Operating expenses decreased 65% from 2008, mainly driven by the absence
of Smith Barney and Nikko Asset Management expenses, re-engineering
efforts and the absence of 2008 one-time expenses ($0.9 billion intangible
impairment, $0.2 billion of restructuring and $0.5 billion of write-downs and
other charges).
Provisions for credit losses and for benefits and claims increased 36%,
mainly reflecting an increase in reserve builds of $28 million.
Assets decreased 3% versus the prior year, mostly driven by the impact of
the sale of Nikko Asset Management.