Citibank 2010 Annual Report Download - page 91
Download and view the complete annual report
Please find page 91 of the 2010 Citibank annual report below. You can navigate through the pages in the report by either clicking on the pages listed below, or by using the keyword search tool below to find specific information within the annual report.-
 1
1 -
2
-
3
-
4
-
5
-
6
-
7
-
8
-
9
-
10
-
11
-
12
-
13
-
14
-
15
-
16
-
17
-
18
-
19
-
20
-
21
-
22
-
23
-
24
-
25
-
26
-
27
-
28
-
29
-
30
-
31
-
32
-
33
-
34
-
35
-
36
-
37
-
38
-
39
-
40
-
41
-
42
-
43
-
44
-
45
-
46
-
47
-
48
-
49
-
50
-
51
-
52
-
53
-
54
-
55
-
56
-
57
-
58
-
59
-
60
-
61
-
62
-
63
-
64
-
65
-
66
-
67
-
68
-
69
-
70
-
71
-
72
-
73
-
74
-
75
-
76
-
77
-
78
-
79
-
80
-
 81
81 -
 82
82 -
 83
83 -
 84
84 -
 85
85 -
 86
86 -
 87
87 -
 88
88 -
 89
89 -
 90
90 -
 91
91 -
 92
92 -
 93
93 -
 94
94 -
 95
95 -
 96
96 -
 97
97 -
 98
98 -
 99
99 -
 100
100 -
 101
101 -
102
-
103
-
104
-
105
-
106
-
107
-
108
-
109
-
110
-
111
-
112
-
113
-
114
-
115
-
116
-
117
-
118
-
119
-
120
-
121
-
122
-
123
-
124
-
125
-
126
-
127
-
128
-
129
-
130
-
131
-
132
-
133
-
134
-
135
-
136
-
137
-
138
-
139
-
140
-
141
-
142
-
143
-
144
-
145
-
146
-
147
-
148
-
149
-
150
-
151
-
152
-
153
-
154
-
155
-
156
-
157
-
158
-
159
-
160
-
161
-
162
-
163
-
164
-
165
-
166
-
167
-
168
-
169
-
170
-
171
-
172
-
173
-
174
-
175
-
176
-
177
-
178
-
179
-
180
-
181
-
182
-
183
-
184
-
185
-
186
-
187
-
188
-
189
-
190
-
191
-
192
-
193
-
194
-
195
-
196
-
197
-
198
-
199
-
200
-
201
-
202
-
203
-
204
-
205
-
206
-
207
-
208
-
209
-
210
-
211
-
212
-
213
-
214
-
215
-
216
-
217
-
218
-
219
-
220
-
221
-
222
-
223
-
224
-
225
-
226
-
227
-
228
-
229
-
230
-
231
-
232
-
233
-
234
-
235
-
236
-
237
-
238
-
239
-
240
-
241
-
242
-
243
-
244
-
245
-
246
-
247
-
248
-
249
-
250
-
251
-
252
-
253
-
254
-
255
-
256
-
257
-
258
-
259
-
260
-
261
-
262
-
263
-
264
-
265
-
266
-
267
-
268
-
269
-
270
-
271
-
272
-
273
-
274
-
275
-
276
-
277
-
278
-
279
-
280
-
281
-
282
-
283
-
284
-
285
-
286
-
287
-
288
-
289
-
290
-
291
-
292
-
293
-
294
-
295
-
296
-
297
-
298
-
299
-
300
-
301
-
302
-
303
-
304
-
305
-
306
-
307
-
308
-
309
-
310
-
311
-
312
 |
 |

89
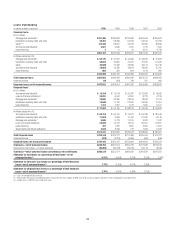
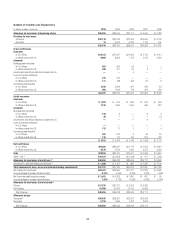
Non-Accrual Loans and Assets
The table below summarizes Citigroup’s view of non-accrual loans as of
the periods indicated. Non-accrual loans are loans in which the borrower
has fallen behind in interest payments or, for Corporate and Consumer
(commercial market) loans, where Citi has determined that the payment of
interest or principal is doubtful, and which are thus considered impaired. In
situations where Citi reasonably expects that only a portion of the principal
and interest owed will ultimately be collected, all payments received are
reflected as a reduction of principal and not as interest income. There is no
industry-wide definition of non-accrual assets, however, and as such, analysis
across the industry is not always comparable.
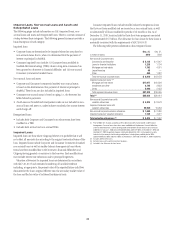
Corporate and Consumer (commercial markets) non-accrual loans
may still be current on interest payments but are considered non-accrual if
Citi has determined that the payment of interest or principal is doubtful. As
referenced above, consistent with industry standards, Citi generally accrues
interest on credit card loans until such loans are charged-off, which typically
occurs at 180 days contractual delinquency. As such, credit card loans are not
included in the table below.
Non-Accrual Loans
In millions of dollars 2010 2009 2008 2007 2006
Citicorp $ 4,909 $ 5,353 $ 3,193 $2,027 $1,141
Citi Holdings 14,498 26,387 19,104 6,941 3,906
Total non-accrual loans (NAL) $19,407 $31,740 $22,297 $8,968 $5,047
Corporate non-accrual loans (1)
North America $ 2,112 $ 5,621 $ 2,660 $ 291 $ 68
EMEA 5,327 6,308 6,330 1,152 128
Latin America 701 569 229 119 152
Asia 470 981 513 103 88
$ 8,610 $13,479 $ 9,732 $1,665 $ 436
Citicorp $ 3,081 $ 3,238 $ 1,364 $ 247 $ 133
Citi Holdings 5,529 10,241 8,368 1,418 303
$ 8,610 $13,479 $ 9,732 $1,665 $ 436
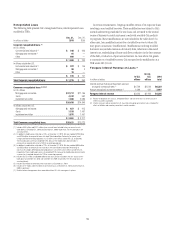
Consumer non-accrual loans (1)
North America $ 8,540 $15,111 $ 9,617 $4,841 $3,139
EMEA 662 1,159 948 696 441
Latin America 1,019 1,340 1,290 1,133 643
Asia 576 651 710 633 388
$10,797 $18,261 $12,565 $7,303 $4,611
Citicorp $ 1,828 $ 2,115 $ 1,829 $1,780 $1,008
Citi Holdings 8,969 16,146 10,736 5,523 3,603
$10,797 $18,261 $12,565 $7,303 $4,611
(1) Excludes purchased distressed loans as they are generally accreting interest. The carrying value of these loans was $469 million at December 31, 2010, $920 million at December 31, 2009, $1.510 billion at
December 31, 2008, $2.373 billion at December 31, 2007, and $949 million at December 31, 2006.
Statement continues on the next page