Citibank 2010 Annual Report Download - page 227
Download and view the complete annual report
Please find page 227 of the 2010 Citibank annual report below. You can navigate through the pages in the report by either clicking on the pages listed below, or by using the keyword search tool below to find specific information within the annual report.-
 1
1 -
2
-
3
-
4
-
5
-
6
-
7
-
8
-
9
-
10
-
11
-
12
-
13
-
14
-
15
-
16
-
17
-
18
-
19
-
20
-
21
-
22
-
23
-
24
-
25
-
26
-
27
-
28
-
29
-
30
-
31
-
32
-
33
-
34
-
35
-
36
-
37
-
38
-
39
-
40
-
41
-
42
-
43
-
44
-
45
-
46
-
47
-
48
-
49
-
50
-
51
-
52
-
53
-
54
-
55
-
56
-
57
-
58
-
59
-
60
-
61
-
62
-
63
-
64
-
65
-
66
-
67
-
68
-
69
-
70
-
71
-
72
-
73
-
74
-
75
-
76
-
77
-
78
-
79
-
80
-
81
-
82
-
83
-
84
-
85
-
86
-
87
-
88
-
89
-
90
-
91
-
92
-
93
-
94
-
95
-
96
-
97
-
98
-
99
-
100
-
101
-
102
-
103
-
104
-
105
-
106
-
107
-
108
-
109
-
110
-
111
-
112
-
113
-
114
-
115
-
116
-
117
-
118
-
119
-
120
-
121
-
122
-
123
-
124
-
125
-
126
-
127
-
128
-
129
-
130
-
131
-
132
-
133
-
134
-
135
-
136
-
137
-
138
-
139
-
140
-
141
-
142
-
143
-
144
-
145
-
146
-
147
-
148
-
149
-
150
-
151
-
152
-
153
-
154
-
155
-
156
-
157
-
158
-
159
-
160
-
161
-
162
-
163
-
164
-
165
-
166
-
167
-
168
-
169
-
170
-
171
-
172
-
173
-
174
-
175
-
176
-
177
-
178
-
179
-
180
-
181
-
182
-
183
-
184
-
185
-
186
-
187
-
188
-
189
-
190
-
191
-
192
-
193
-
194
-
195
-
196
-
197
-
198
-
199
-
200
-
201
-
202
-
203
-
204
-
205
-
206
-
207
-
208
-
209
-
210
-
211
-
212
-
213
-
214
-
215
-
216
-
 217
217 -
 218
218 -
 219
219 -
 220
220 -
 221
221 -
 222
222 -
 223
223 -
 224
224 -
 225
225 -
 226
226 -
 227
227 -
 228
228 -
 229
229 -
 230
230 -
 231
231 -
 232
232 -
 233
233 -
 234
234 -
 235
235 -
 236
236 -
 237
237 -
238
-
239
-
240
-
241
-
242
-
243
-
244
-
245
-
246
-
247
-
248
-
249
-
250
-
251
-
252
-
253
-
254
-
255
-
256
-
257
-
258
-
259
-
260
-
261
-
262
-
263
-
264
-
265
-
266
-
267
-
268
-
269
-
270
-
271
-
272
-
273
-
274
-
275
-
276
-
277
-
278
-
279
-
280
-
281
-
282
-
283
-
284
-
285
-
286
-
287
-
288
-
289
-
290
-
291
-
292
-
293
-
294
-
295
-
296
-
297
-
298
-
299
-
300
-
301
-
302
-
303
-
304
-
305
-
306
-
307
-
308
-
309
-
310
-
311
-
312
 |
 |

225
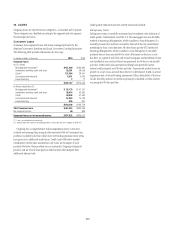
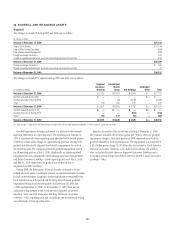
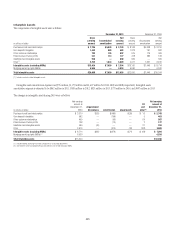
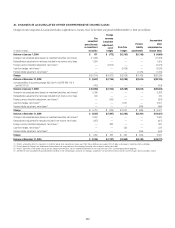
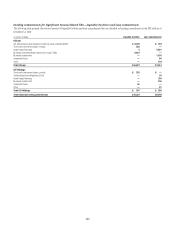
Intangible Assets
The components of intangible assets were as follows:
December 31, 2010 December 31, 2009
In millions of dollars
Gross
carrying
amount
Accumulated
amortization
Net
carrying
amount
Gross
carrying
amount
Accumulated
amortization
Net
carrying
amount
Purchased credit card relationships $ 7,796 $ 5,048 $ 2,748 $ 8,148 $4,838 $ 3,310
Core deposit intangibles 1,442 959 483 1,373 791 582
Other customer relationships 702 195 507 675 176 499
Present value of future profits 241 114 127 418 280 138
Indefinite-lived intangible assets 550 — 550 569 — 569
Other (1) 4,723 1,634 3,089 4,977 1,361 3,616
Intangible assets (excluding MSRs) $15,454 $ 7,950 $ 7,504 $16,160 $7,446 $ 8,714
Mortgage servicing rights (MSRs) 4,554 — 4,554 6,530 — 6,530
Total intangible assets $20,008 $7,950 $12,058 $22,690 $7,446 $15,244
(1) Includes contract-related intangible assets.
Intangible assets amortization expense was $976 million, $1,179 million and $1,427 million for 2010, 2009 and 2008, respectively. Intangible assets
amortization expense is estimated to be $862 million in 2011, $838 million in 2012, $825 million in 2013, $779 million in 2014, and $697 million in 2015.
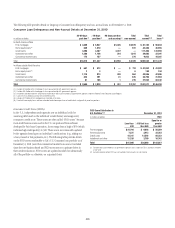
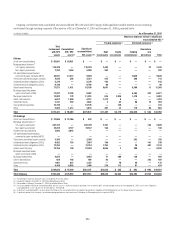
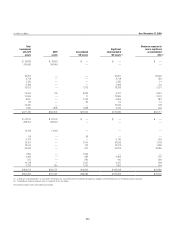
The changes in intangible assets during 2010 were as follows:
In millions of dollars
Net carrying
amount at
December 31,
2009
Acquisitions/
divestitures Amortization Impairments
FX
and
other (1)
Net carrying
amount at
December 31,
2010
Purchased credit card relationships $ 3,310 $(53) $ (486) $ (39) $ 16 $ 2,748
Core deposit intangibles 582 — (108) — 9 483
Other customer relationships 499 — (56) — 64 507
Present value of future profits 138 — (13) — 2 127
Indefinite-lived intangible assets 569 (46) — — 27 550
Other 3,616 — (313) (32) (182) 3,089
Intangible assets (excluding MSRs) $ 8,714 $(99) $ (976) $ (71) $ (64) $ 7,504
Mortgage servicing rights (MSRs) (2) 6,530 4,554
Total intangible assets $15,244 $12,058
(1) Includes foreign exchange translation and purchase accounting adjustments.
(2) See Note 22 to the Consolidated Financial Statements for the roll-forward of MSRs.