Citibank 2010 Annual Report Download - page 184
Download and view the complete annual report
Please find page 184 of the 2010 Citibank annual report below. You can navigate through the pages in the report by either clicking on the pages listed below, or by using the keyword search tool below to find specific information within the annual report.-
 1
1 -
2
-
3
-
4
-
5
-
6
-
7
-
8
-
9
-
10
-
11
-
12
-
13
-
14
-
15
-
16
-
17
-
18
-
19
-
20
-
21
-
22
-
23
-
24
-
25
-
26
-
27
-
28
-
29
-
30
-
31
-
32
-
33
-
34
-
35
-
36
-
37
-
38
-
39
-
40
-
41
-
42
-
43
-
44
-
45
-
46
-
47
-
48
-
49
-
50
-
51
-
52
-
53
-
54
-
55
-
56
-
57
-
58
-
59
-
60
-
61
-
62
-
63
-
64
-
65
-
66
-
67
-
68
-
69
-
70
-
71
-
72
-
73
-
74
-
75
-
76
-
77
-
78
-
79
-
80
-
81
-
82
-
83
-
84
-
85
-
86
-
87
-
88
-
89
-
90
-
91
-
92
-
93
-
94
-
95
-
96
-
97
-
98
-
99
-
100
-
101
-
102
-
103
-
104
-
105
-
106
-
107
-
108
-
109
-
110
-
111
-
112
-
113
-
114
-
115
-
116
-
117
-
118
-
119
-
120
-
121
-
122
-
123
-
124
-
125
-
126
-
127
-
128
-
129
-
130
-
131
-
132
-
133
-
134
-
135
-
136
-
137
-
138
-
139
-
140
-
141
-
142
-
143
-
144
-
145
-
146
-
147
-
148
-
149
-
150
-
151
-
152
-
153
-
154
-
155
-
156
-
157
-
158
-
159
-
160
-
161
-
162
-
163
-
164
-
165
-
166
-
167
-
168
-
169
-
170
-
171
-
172
-
173
-
 174
174 -
 175
175 -
 176
176 -
 177
177 -
 178
178 -
 179
179 -
 180
180 -
 181
181 -
 182
182 -
 183
183 -
 184
184 -
 185
185 -
 186
186 -
 187
187 -
 188
188 -
 189
189 -
 190
190 -
 191
191 -
 192
192 -
 193
193 -
 194
194 -
195
-
196
-
197
-
198
-
199
-
200
-
201
-
202
-
203
-
204
-
205
-
206
-
207
-
208
-
209
-
210
-
211
-
212
-
213
-
214
-
215
-
216
-
217
-
218
-
219
-
220
-
221
-
222
-
223
-
224
-
225
-
226
-
227
-
228
-
229
-
230
-
231
-
232
-
233
-
234
-
235
-
236
-
237
-
238
-
239
-
240
-
241
-
242
-
243
-
244
-
245
-
246
-
247
-
248
-
249
-
250
-
251
-
252
-
253
-
254
-
255
-
256
-
257
-
258
-
259
-
260
-
261
-
262
-
263
-
264
-
265
-
266
-
267
-
268
-
269
-
270
-
271
-
272
-
273
-
274
-
275
-
276
-
277
-
278
-
279
-
280
-
281
-
282
-
283
-
284
-
285
-
286
-
287
-
288
-
289
-
290
-
291
-
292
-
293
-
294
-
295
-
296
-
297
-
298
-
299
-
300
-
301
-
302
-
303
-
304
-
305
-
306
-
307
-
308
-
309
-
310
-
311
-
312
 |
 |

182
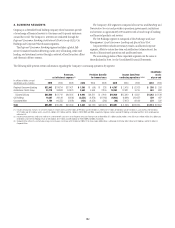
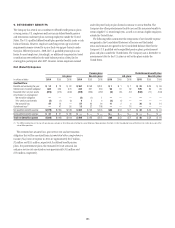
4. BUSINESS SEGMENTS
Citigroup is a diversified bank holding company whose businesses provide
a broad range of financial services to Consumer and Corporate customers
around the world. The Company’s activities are conducted through the
Regional Consumer Banking, Institutional Clients Group (ICG), Citi
Holdings and Corporate/Other business segments.
The Regional Consumer Banking segment includes a global, full-
service Consumer franchise delivering a wide array of banking, credit card
lending, and investment services through a network of local branches, offices
and electronic delivery systems.
The Company’s ICG segment is composed of Securities and Banking and
Transaction Services and provides corporations, governments, institutions
and investors in approximately 100 countries with a broad range of banking
and financial products and services.
The Citi Holdings segment is composed of the Brokerage and Asset
Management, Local Consumer Lending and Special Asset Pool.
Corporate/Other includes net treasury results, unallocated corporate
expenses, offsets to certain line-item reclassifications (eliminations), the
results of discontinued operations and unallocated taxes.
The accounting policies of these reportable segments are the same as
those disclosed in Note 1 to the Consolidated Financial Statements.
The following table presents certain information regarding the Company’s continuing operations by segment:
Revenues,
net of interest expense (1)
Provision (benefit)
for income taxes
Income (loss) from
continuing operations (1)(2)(3)
Identifiable
assets
at year end
In millions of dollars, except
identifiable assets in billions 2010 2009 2008 2010 2009 2008 2010 2009 2008 2010 2009
Regional Consumer Banking $32,442 $ 24,814 $27,421 $ 1,396 $ (98) $ 235 $ 4,767 $ 2,478 $ (2,767) $ 330 $ 256
Institutional Clients Group 33,118 36,898 34,674 3,544 4,599 2,209 10,253 12,921 9,419 953 882
Subtotal Citicorp $65,560 $ 61,712 $62,095 $ 4,940 $ 4,501 $ 2,444 $15,020 $15,399 $ 6,652 $1,283 $1,138
Citi Holdings 19,287 29,128 (8,238) (2,554) (6,878) (22,185) (4,023) (8,848) (36,497) 359 487
Corporate/Other 1,754 (10,555) (2,258) (153) (4,356) (585) (46) (7,617) (2,184) 272 232
Total $86,601 $ 80,285 $51,599 $ 2,233 $(6,733) $(20,326) $10,951 $ (1,066) $(32,029) $1,914 $1,857
(1) Includes Citicorp total revenues, net of interest expense, in North America of $26.7 billion, $19.9 billion and $21.6 billion; in EMEA of $11.7 billion, $15.0 billion and $11.5 billion; in Latin America of $12.8 billion,
$12.7 billion and $13.3 billion; and in Asia of $14.4 billion, $14.1 billion and $15.7 billion in 2010, 2009 and 2008, respectively. Regional numbers exclude Citi Holdings and Corporate/Other, which largely operate
within the U.S.
(2) Includes pretax provisions (credits) for credit losses and for benefits and claims in the Regional Consumer Banking results of $9.8 billion, $7.4 billion and $6.3 billion; in the ICG results of $(84) million, $1.8 billion and
$2.0 billion; and in the Citi Holdings results of $16.3 billion, $31.1 billion and $26.3 billion for 2010, 2009 and 2008, respectively.
(3) Corporate/Other reflects the restructuring charge, net of changes in estimates of $1.5 billion for 2008. Of the total charge, $890 million is attributable to Citicorp; $267 million to Citi Holdings; and $373 million to
Corporate/Other.