Citibank 2010 Annual Report Download - page 165
Download and view the complete annual report
Please find page 165 of the 2010 Citibank annual report below. You can navigate through the pages in the report by either clicking on the pages listed below, or by using the keyword search tool below to find specific information within the annual report.-
 1
1 -
2
-
3
-
4
-
5
-
6
-
7
-
8
-
9
-
10
-
11
-
12
-
13
-
14
-
15
-
16
-
17
-
18
-
19
-
20
-
21
-
22
-
23
-
24
-
25
-
26
-
27
-
28
-
29
-
30
-
31
-
32
-
33
-
34
-
35
-
36
-
37
-
38
-
39
-
40
-
41
-
42
-
43
-
44
-
45
-
46
-
47
-
48
-
49
-
50
-
51
-
52
-
53
-
54
-
55
-
56
-
57
-
58
-
59
-
60
-
61
-
62
-
63
-
64
-
65
-
66
-
67
-
68
-
69
-
70
-
71
-
72
-
73
-
74
-
75
-
76
-
77
-
78
-
79
-
80
-
81
-
82
-
83
-
84
-
85
-
86
-
87
-
88
-
89
-
90
-
91
-
92
-
93
-
94
-
95
-
96
-
97
-
98
-
99
-
100
-
101
-
102
-
103
-
104
-
105
-
106
-
107
-
108
-
109
-
110
-
111
-
112
-
113
-
114
-
115
-
116
-
117
-
118
-
119
-
120
-
121
-
122
-
123
-
124
-
125
-
126
-
127
-
128
-
129
-
130
-
131
-
132
-
133
-
134
-
135
-
136
-
137
-
138
-
139
-
140
-
141
-
142
-
143
-
144
-
145
-
146
-
147
-
148
-
149
-
150
-
151
-
152
-
153
-
154
-
 155
155 -
 156
156 -
 157
157 -
 158
158 -
 159
159 -
 160
160 -
 161
161 -
 162
162 -
 163
163 -
 164
164 -
 165
165 -
 166
166 -
 167
167 -
 168
168 -
 169
169 -
 170
170 -
 171
171 -
 172
172 -
 173
173 -
 174
174 -
 175
175 -
176
-
177
-
178
-
179
-
180
-
181
-
182
-
183
-
184
-
185
-
186
-
187
-
188
-
189
-
190
-
191
-
192
-
193
-
194
-
195
-
196
-
197
-
198
-
199
-
200
-
201
-
202
-
203
-
204
-
205
-
206
-
207
-
208
-
209
-
210
-
211
-
212
-
213
-
214
-
215
-
216
-
217
-
218
-
219
-
220
-
221
-
222
-
223
-
224
-
225
-
226
-
227
-
228
-
229
-
230
-
231
-
232
-
233
-
234
-
235
-
236
-
237
-
238
-
239
-
240
-
241
-
242
-
243
-
244
-
245
-
246
-
247
-
248
-
249
-
250
-
251
-
252
-
253
-
254
-
255
-
256
-
257
-
258
-
259
-
260
-
261
-
262
-
263
-
264
-
265
-
266
-
267
-
268
-
269
-
270
-
271
-
272
-
273
-
274
-
275
-
276
-
277
-
278
-
279
-
280
-
281
-
282
-
283
-
284
-
285
-
286
-
287
-
288
-
289
-
290
-
291
-
292
-
293
-
294
-
295
-
296
-
297
-
298
-
299
-
300
-
301
-
302
-
303
-
304
-
305
-
306
-
307
-
308
-
309
-
310
-
311
-
312
 |
 |
163
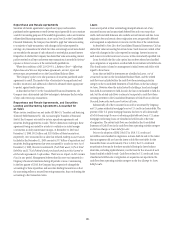
recoveries are added. Securities received in exchange for loan claims in
debt restructurings are initially recorded at fair value, with any gain or loss
reflected as a recovery or charge-off to the allowance, and are subsequently
accounted for as securities available-for-sale.
Corporate loans
In the corporate portfolios, the allowance for loan losses includes an asset-
specific component and a statistically-based component. The asset-specific
component is calculated under ASC 310-10-35, Receivables—Subsequent
Measurement (formerly SFAS 114) on an individual basis for larger-
balance, non-homogeneous loans, which are considered impaired. An
asset-specific allowance is established when the discounted cash flows,
collateral value (less disposal costs), or observable market price of the
impaired loan is lower than its carrying value. This allowance considers the
borrower’s overall financial condition, resources, and payment record, the
prospects for support from any financially responsible guarantors (discussed
further below) and, if appropriate, the realizable value of any collateral.
The asset-specific component of the allowance for smaller balance impaired
loans is calculated on a pool basis considering historical loss experience.
The allowance for the remainder of the loan portfolio is calculated under
ASC 450, Contingencies (formerly SFAS 5) using a statistical methodology,
supplemented by management judgment. The statistical analysis considers
the portfolio’s size, remaining tenor, and credit quality as measured by
internal risk ratings assigned to individual credit facilities, which reflect
probability of default and loss given default. The statistical analysis considers
historical default rates and historical loss severity in the event of default,
including historical average levels and historical variability. The result is
an estimated range for inherent losses. The best estimate within the range is
then determined by management’s quantitative and qualitative assessment
of current conditions, including general economic conditions, specific
industry and geographic trends, and internal factors including portfolio
concentrations, trends in internal credit quality indicators, and current and
past underwriting standards.
For both the asset-specific and the statistically based components of the
allowance for loan losses, management may incorporate guarantor support.
The financial wherewithal of the guarantor is evaluated, as applicable,
based on net worth, cash flow statements and personal or company financial
statements which are updated and reviewed at least annually. Citi seeks
performance on guarantee arrangements in the normal course of business.
Seeking performance entails obtaining satisfactory cooperation from the
guarantor or borrower to achieve Citi’s strategy in the specific situation. This
regular cooperation is indicative of pursuit and successful enforcement of
the guarantee: the exposure is reduced without the expense and burden of
pursuing a legal remedy. Enforcing a guarantee via legal action against the
guarantor is not the primary means of resolving a troubled loan situation
and rarely occurs. A guarantor’s reputation and willingness to work with
Citigroup is evaluated based on the historical experience with the guarantor
and the knowledge of the marketplace. In the rare event that the guarantor
is unwilling or unable to perform or facilitate borrower cooperation, Citi
pursues a legal remedy. If Citi does not pursue a legal remedy, it is because
Citi does not believe that the guarantor has the financial wherewithal to
perform regardless of legal action, or because there are legal limitations
on simultaneously pursuing guarantors and foreclosure. A guarantor’s
reputation does not impact our decision or ability to seek performance
under guarantee.
In cases where a guarantee is a factor in the assessment of loan losses,
it is included via adjustment to the loan’s internal risk rating, which in
turn is the basis for the adjustment to the statistically based component of
the allowance for loan losses. To date, it is only in rare circumstances that
an impaired commercial or CRE loan is carried at a value in excess of the
appraised value due to a guarantee.
When Citi’s monitoring of the loan indicates that the guarantor’s
wherewithal to pay is uncertain or has deteriorated, there is either no
change in the risk rating, because the guarantor’s credit support was never
initially factored in, or the risk rating is adjusted to reflect that uncertainty
or deterioration. Accordingly, a guarantor’s ultimate failure to perform or
a lack of legal enforcement of the guarantee does not materially impact
the allowance for loan losses, as there is typically no further significant
adjustment of the loan’s risk rating at that time. Where Citi is not seeking
performance under the guarantee contract, it provides for loans losses as if
the loans were non-performing and not guaranteed.
Consumer loans
For Consumer loans, each portfolio of smaller-balance, homogeneous
loans—including Consumer mortgage, installment, revolving credit, and
most other Consumer loans—is independently evaluated for impairment.
The allowance for loan losses attributed to these loans is established via a
process that estimates the probable losses inherent in the specific portfolio
based upon various analyses. These include migration analysis, in which
historical delinquency and credit loss experience is applied to the current
aging of the portfolio, together with analyses that reflect current trends
and conditions.
Management also considers overall portfolio indicators, including
historical credit losses, delinquent, non-performing, and classified loans,
trends in volumes and terms of loans, an evaluation of overall credit quality,
the credit process, including lending policies and procedures, and economic,
geographical, product and other environmental factors.
In addition, valuation allowances are determined for impaired smaller-
balance homogeneous loans whose terms have been modified due to the
borrowers’ financial difficulties and where it has been determined that a
concession was granted to the borrower. Such modifications may include
interest rate reductions, principal forgiveness and/or term extensions. Where
long-term concessions have been granted, such modifications are accounted
for as troubled debt restructurings (TDRs). The allowance for loan losses
for TDRs is determined in accordance with ASC 310-10-35 by comparing
expected cash flows of the loans discounted at the loans’ original effective
interest rates to the carrying value of the loans. Where short-term concessions
have been granted, the allowance for loan losses is materially consistent with
the requirements of ASC 310-10-35.