Citibank 2010 Annual Report Download - page 85
Download and view the complete annual report
Please find page 85 of the 2010 Citibank annual report below. You can navigate through the pages in the report by either clicking on the pages listed below, or by using the keyword search tool below to find specific information within the annual report.-
 1
1 -
2
-
3
-
4
-
5
-
6
-
7
-
8
-
9
-
10
-
11
-
12
-
13
-
14
-
15
-
16
-
17
-
18
-
19
-
20
-
21
-
22
-
23
-
24
-
25
-
26
-
27
-
28
-
29
-
30
-
31
-
32
-
33
-
34
-
35
-
36
-
37
-
38
-
39
-
40
-
41
-
42
-
43
-
44
-
45
-
46
-
47
-
48
-
49
-
50
-
51
-
52
-
53
-
54
-
55
-
56
-
57
-
58
-
59
-
60
-
61
-
62
-
63
-
64
-
65
-
66
-
67
-
68
-
69
-
70
-
71
-
72
-
73
-
74
-
 75
75 -
 76
76 -
 77
77 -
 78
78 -
 79
79 -
 80
80 -
 81
81 -
 82
82 -
 83
83 -
 84
84 -
 85
85 -
 86
86 -
 87
87 -
 88
88 -
 89
89 -
 90
90 -
 91
91 -
 92
92 -
 93
93 -
 94
94 -
 95
95 -
96
-
97
-
98
-
99
-
100
-
101
-
102
-
103
-
104
-
105
-
106
-
107
-
108
-
109
-
110
-
111
-
112
-
113
-
114
-
115
-
116
-
117
-
118
-
119
-
120
-
121
-
122
-
123
-
124
-
125
-
126
-
127
-
128
-
129
-
130
-
131
-
132
-
133
-
134
-
135
-
136
-
137
-
138
-
139
-
140
-
141
-
142
-
143
-
144
-
145
-
146
-
147
-
148
-
149
-
150
-
151
-
152
-
153
-
154
-
155
-
156
-
157
-
158
-
159
-
160
-
161
-
162
-
163
-
164
-
165
-
166
-
167
-
168
-
169
-
170
-
171
-
172
-
173
-
174
-
175
-
176
-
177
-
178
-
179
-
180
-
181
-
182
-
183
-
184
-
185
-
186
-
187
-
188
-
189
-
190
-
191
-
192
-
193
-
194
-
195
-
196
-
197
-
198
-
199
-
200
-
201
-
202
-
203
-
204
-
205
-
206
-
207
-
208
-
209
-
210
-
211
-
212
-
213
-
214
-
215
-
216
-
217
-
218
-
219
-
220
-
221
-
222
-
223
-
224
-
225
-
226
-
227
-
228
-
229
-
230
-
231
-
232
-
233
-
234
-
235
-
236
-
237
-
238
-
239
-
240
-
241
-
242
-
243
-
244
-
245
-
246
-
247
-
248
-
249
-
250
-
251
-
252
-
253
-
254
-
255
-
256
-
257
-
258
-
259
-
260
-
261
-
262
-
263
-
264
-
265
-
266
-
267
-
268
-
269
-
270
-
271
-
272
-
273
-
274
-
275
-
276
-
277
-
278
-
279
-
280
-
281
-
282
-
283
-
284
-
285
-
286
-
287
-
288
-
289
-
290
-
291
-
292
-
293
-
294
-
295
-
296
-
297
-
298
-
299
-
300
-
301
-
302
-
303
-
304
-
305
-
306
-
307
-
308
-
309
-
310
-
311
-
312
 |
 |
83
CREDIT RISK
Credit risk is the potential for financial loss resulting from the failure of a
borrower or counterparty to honor its financial or contractual obligations.
Credit risk arises in many of Citigroup’s business activities, including:
lending; •
sales and trading; •
derivatives; •
securities transactions; •
settlement; and •
when Citigroup acts as an intermediary.•
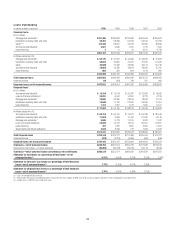
Loan and Credit Overview
During 2010, Citigroup’s aggregate loan portfolio increased by $57.3 billion
to $648.8 billion primarily due to the adoption of SFAS 166/167 on
January 1, 2010. Excluding the impact of SFAS 166/167, the aggregate loan
portfolio decreased by $102.1 billon. Citi’s total allowance for loan losses
totaled $40.7 billion at December 31, 2010, a coverage ratio of 6.31% of total
loans, up from 6.09% at December 31, 2009.
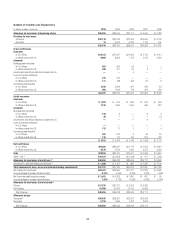
During 2010, Citi had a net release of $5.8 billion from its credit reserves
and allowance for unfunded lending commitments, compared to a net build
of $8.3 billion in 2009. The release consisted of a net release of $2.5 billion
for Corporate loans (primarily in SAP) and a net release of $3.3 billion for
Consumer loans (mainly a $1.5 billion release in RCB and a $1.8 billion
release in LCL). Despite the reserve release for Consumer loans, the
coincident months of net credit loss coverage for the Consumer portfolio
increased from 13.7 months in 2009 to 15.0 months in 2010.
Net credit losses of $30.9 billion during 2010 decreased $11.4 billion
from year-ago levels (on a managed basis). The decrease consisted of a net
decrease of $7.9 billion for Consumer loans (mainly a $1.1 billion decrease
in RCB and a $6.7 billion decrease in LCL) and a decrease of $3.5 billion for
corporate loans (almost all of which is related to SAP).
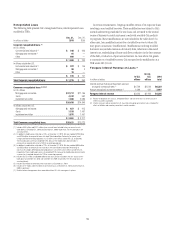
Consumer non-accrual loans (which generally exclude credit cards with
the exception of certain international portfolios) totaled $10.8 billion at
December 31, 2010, compared to $18.3 billion at December 31, 2009. For
total Consumer loans, the 90 days or more past due delinquency rate was
2.99% at December 31, 2010, compared to 4.29% at December 31, 2009 (on a
managed basis). The 30 to 89 days past due Consumer loan delinquency rate
was 2.92% at December 31, 2010, compared to 3.50% at December 31, 2009
(on a managed basis). During 2010, early- and later-stage delinquencies
improved on a dollar basis across most of the Consumer loan portfolios,
driven by improvement in North America mortgages, both in first and
second mortgages, Citi-branded cards in Citicorp and retail partner cards in
Citi Holdings. The improvement in first mortgages was driven by asset sales
and loans moving to permanent modifications.
Corporate non-accrual loans were $8.6 billion at December 31, 2010,
compared to $13.5 billion at December 31, 2009. The decrease in non-
accrual loans from the prior year was mainly due to loan sales, write-offs and
paydowns, which were partially offset by increases due to the weakening of
certain borrowers.
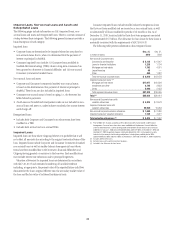
For Citi’s loan accounting policies, see Note 1 to the Consolidated
Financial Statements. See Notes 16 and 17 for additional information on
Citigroup’s Consumer and Corporate loan, credit and allowance data.