Citibank 2010 Annual Report Download - page 278
Download and view the complete annual report
Please find page 278 of the 2010 Citibank annual report below. You can navigate through the pages in the report by either clicking on the pages listed below, or by using the keyword search tool below to find specific information within the annual report.-
 1
1 -
2
-
3
-
4
-
5
-
6
-
7
-
8
-
9
-
10
-
11
-
12
-
13
-
14
-
15
-
16
-
17
-
18
-
19
-
20
-
21
-
22
-
23
-
24
-
25
-
26
-
27
-
28
-
29
-
30
-
31
-
32
-
33
-
34
-
35
-
36
-
37
-
38
-
39
-
40
-
41
-
42
-
43
-
44
-
45
-
46
-
47
-
48
-
49
-
50
-
51
-
52
-
53
-
54
-
55
-
56
-
57
-
58
-
59
-
60
-
61
-
62
-
63
-
64
-
65
-
66
-
67
-
68
-
69
-
70
-
71
-
72
-
73
-
74
-
75
-
76
-
77
-
78
-
79
-
80
-
81
-
82
-
83
-
84
-
85
-
86
-
87
-
88
-
89
-
90
-
91
-
92
-
93
-
94
-
95
-
96
-
97
-
98
-
99
-
100
-
101
-
102
-
103
-
104
-
105
-
106
-
107
-
108
-
109
-
110
-
111
-
112
-
113
-
114
-
115
-
116
-
117
-
118
-
119
-
120
-
121
-
122
-
123
-
124
-
125
-
126
-
127
-
128
-
129
-
130
-
131
-
132
-
133
-
134
-
135
-
136
-
137
-
138
-
139
-
140
-
141
-
142
-
143
-
144
-
145
-
146
-
147
-
148
-
149
-
150
-
151
-
152
-
153
-
154
-
155
-
156
-
157
-
158
-
159
-
160
-
161
-
162
-
163
-
164
-
165
-
166
-
167
-
168
-
169
-
170
-
171
-
172
-
173
-
174
-
175
-
176
-
177
-
178
-
179
-
180
-
181
-
182
-
183
-
184
-
185
-
186
-
187
-
188
-
189
-
190
-
191
-
192
-
193
-
194
-
195
-
196
-
197
-
198
-
199
-
200
-
201
-
202
-
203
-
204
-
205
-
206
-
207
-
208
-
209
-
210
-
211
-
212
-
213
-
214
-
215
-
216
-
217
-
218
-
219
-
220
-
221
-
222
-
223
-
224
-
225
-
226
-
227
-
228
-
229
-
230
-
231
-
232
-
233
-
234
-
235
-
236
-
237
-
238
-
239
-
240
-
241
-
242
-
243
-
244
-
245
-
246
-
247
-
248
-
249
-
250
-
251
-
252
-
253
-
254
-
255
-
256
-
257
-
258
-
259
-
260
-
261
-
262
-
263
-
264
-
265
-
266
-
267
-
 268
268 -
 269
269 -
 270
270 -
 271
271 -
 272
272 -
 273
273 -
 274
274 -
 275
275 -
 276
276 -
 277
277 -
 278
278 -
 279
279 -
 280
280 -
 281
281 -
 282
282 -
 283
283 -
 284
284 -
 285
285 -
 286
286 -
 287
287 -
 288
288 -
289
-
290
-
291
-
292
-
293
-
294
-
295
-
296
-
297
-
298
-
299
-
300
-
301
-
302
-
303
-
304
-
305
-
306
-
307
-
308
-
309
-
310
-
311
-
312
 |
 |

276
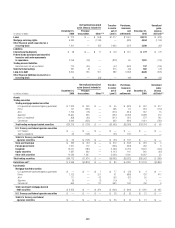
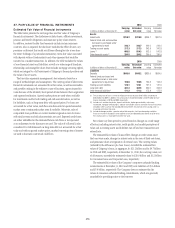
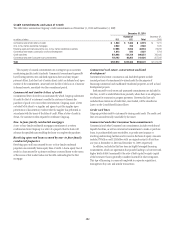
27. FAIR VALUE OF FINANCIAL INSTRUMENTS
Estimated Fair Value of Financial Instruments
The table below presents the carrying value and fair value of Citigroup’s
financial instruments. The disclosure excludes leases, affiliate investments,
pension and benefit obligations and insurance policy claim reserves.
In addition, contract-holder fund amounts exclude certain insurance
contracts. Also as required, the disclosure excludes the effect of taxes, any
premium or discount that could result from offering for sale at one time
the entire holdings of a particular instrument, excess fair value associated
with deposits with no fixed maturity and other expenses that would be
incurred in a market transaction. In addition, the table excludes the values
of non-financial assets and liabilities, as well as a wide range of franchise,
relationship and intangible values (but includes mortgage servicing rights),
which are integral to a full assessment of Citigroup’s financial position and
the value of its net assets.
The fair value represents management’s best estimates based on a
range of methodologies and assumptions. The carrying value of short-term
financial instruments not accounted for at fair value, as well as receivables
and payables arising in the ordinary course of business, approximates fair
value because of the relatively short period of time between their origination
and expected realization. Quoted market prices are used when available
for investments and for both trading and end-user derivatives, as well as
for liabilities, such as long-term debt, with quoted prices. For loans not
accounted for at fair value, cash flows are discounted at quoted secondary
market rates or estimated market rates if available. Otherwise, sales of
comparable loan portfolios or current market origination rates for loans
with similar terms and risk characteristics are used. Expected credit losses
are either embedded in the estimated future cash flows or incorporated
as an adjustment to the discount rate used. The value of collateral is also
considered. For liabilities such as long-term debt not accounted for at fair
value and without quoted market prices, market borrowing rates of interest
are used to discount contractual cash flows.
2010 2009
In billions of dollars at December 31,
Carrying
value
Estimated
fair value
Carrying
value
Estimated
fair value
Assets
Investments $318.2 $319.0 $306.1 $307.6
Federal funds sold and securities
borrowed or purchased under
agreements to resell 246.7 246.7 222.0 222.0
Trading account assets 317.3 317.3 342.8 342.8
Loans (1) 605.5 584.3 552.5 542.8
Other financial assets (2) 280.5 280.2 290.9 290.9
2010 2009
In billions of dollars at December 31,
Carrying
value
Estimated
fair value
Carrying
value
Estimated
fair value
Liabilities
Deposits $845.0 $843.2 $835.9 $834.5
Federal funds purchased and
securities loaned or sold under
agreements to repurchase 189.6 189.6 154.3 154.3
Trading account liabilities 129.1 129.1 137.5 137.5
Long-term debt 381.2 384.5 364.0 354.8
Other financial liabilities (3) 171.2 171.2 175.8 175.8
(1) The carrying value of loans is net of the Allowance for loan losses of $40.7 billion for 2010 and
$36.0 billion for 2009. In addition, the carrying values exclude $2.6 billion and $2.9 billion of lease
finance receivables in 2010 and 2009, respectively.
(2) Includes cash and due from banks, deposits with banks, brokerage receivables, reinsurance
recoverable, mortgage servicing rights, separate and variable accounts and other financial instruments
included in Other assets on the Consolidated Balance Sheet, for all of which the carrying value is a
reasonable estimate of fair value.
(3) Includes brokerage payables, separate and variable accounts, short-term borrowings and other
financial instruments included in Other liabilities on the Consolidated Balance Sheet, for all of which
the carrying value is a reasonable estimate of fair value.
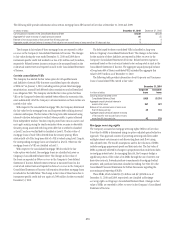
Fair values vary from period to period based on changes in a wide range
of factors, including interest rates, credit quality, and market perceptions of
value and as existing assets and liabilities run off and new transactions are
entered into.
The estimated fair values of loans reflect changes in credit status since
the loans were made, changes in interest rates in the case of fixed-rate loans,
and premium values at origination of certain loans. The carrying values
(reduced by the Allowance for loan losses) exceeded the estimated fair
values of Citigroup’s loans, in aggregate, by $21.2 billion and by $9.7 billion
in 2010 and 2009, respectively. At December 31, 2010, the carrying values, net
of allowances, exceeded the estimated values by $20.0 billion and $1.2 billion
for Consumer loans and Corporate loans, respectively.
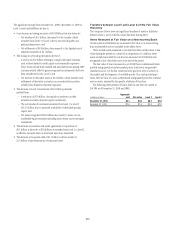
The estimated fair values of the Company’s corporate unfunded lending
commitments at December 31, 2010 and 2009 were liabilities of $5.6 billion
and $5.0 billion, respectively. The Company does not estimate the fair
values of consumer unfunded lending commitments, which are generally
cancelable by providing notice to the borrower.