Citibank 2010 Annual Report Download - page 273
Download and view the complete annual report
Please find page 273 of the 2010 Citibank annual report below. You can navigate through the pages in the report by either clicking on the pages listed below, or by using the keyword search tool below to find specific information within the annual report.-
 1
1 -
2
-
3
-
4
-
5
-
6
-
7
-
8
-
9
-
10
-
11
-
12
-
13
-
14
-
15
-
16
-
17
-
18
-
19
-
20
-
21
-
22
-
23
-
24
-
25
-
26
-
27
-
28
-
29
-
30
-
31
-
32
-
33
-
34
-
35
-
36
-
37
-
38
-
39
-
40
-
41
-
42
-
43
-
44
-
45
-
46
-
47
-
48
-
49
-
50
-
51
-
52
-
53
-
54
-
55
-
56
-
57
-
58
-
59
-
60
-
61
-
62
-
63
-
64
-
65
-
66
-
67
-
68
-
69
-
70
-
71
-
72
-
73
-
74
-
75
-
76
-
77
-
78
-
79
-
80
-
81
-
82
-
83
-
84
-
85
-
86
-
87
-
88
-
89
-
90
-
91
-
92
-
93
-
94
-
95
-
96
-
97
-
98
-
99
-
100
-
101
-
102
-
103
-
104
-
105
-
106
-
107
-
108
-
109
-
110
-
111
-
112
-
113
-
114
-
115
-
116
-
117
-
118
-
119
-
120
-
121
-
122
-
123
-
124
-
125
-
126
-
127
-
128
-
129
-
130
-
131
-
132
-
133
-
134
-
135
-
136
-
137
-
138
-
139
-
140
-
141
-
142
-
143
-
144
-
145
-
146
-
147
-
148
-
149
-
150
-
151
-
152
-
153
-
154
-
155
-
156
-
157
-
158
-
159
-
160
-
161
-
162
-
163
-
164
-
165
-
166
-
167
-
168
-
169
-
170
-
171
-
172
-
173
-
174
-
175
-
176
-
177
-
178
-
179
-
180
-
181
-
182
-
183
-
184
-
185
-
186
-
187
-
188
-
189
-
190
-
191
-
192
-
193
-
194
-
195
-
196
-
197
-
198
-
199
-
200
-
201
-
202
-
203
-
204
-
205
-
206
-
207
-
208
-
209
-
210
-
211
-
212
-
213
-
214
-
215
-
216
-
217
-
218
-
219
-
220
-
221
-
222
-
223
-
224
-
225
-
226
-
227
-
228
-
229
-
230
-
231
-
232
-
233
-
234
-
235
-
236
-
237
-
238
-
239
-
240
-
241
-
242
-
243
-
244
-
245
-
246
-
247
-
248
-
249
-
250
-
251
-
252
-
253
-
254
-
255
-
256
-
257
-
258
-
259
-
260
-
261
-
262
-
 263
263 -
 264
264 -
 265
265 -
 266
266 -
 267
267 -
 268
268 -
 269
269 -
 270
270 -
 271
271 -
 272
272 -
 273
273 -
 274
274 -
 275
275 -
 276
276 -
 277
277 -
 278
278 -
 279
279 -
 280
280 -
 281
281 -
 282
282 -
 283
283 -
284
-
285
-
286
-
287
-
288
-
289
-
290
-
291
-
292
-
293
-
294
-
295
-
296
-
297
-
298
-
299
-
300
-
301
-
302
-
303
-
304
-
305
-
306
-
307
-
308
-
309
-
310
-
311
-
312
 |
 |

271
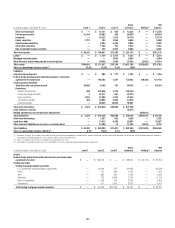
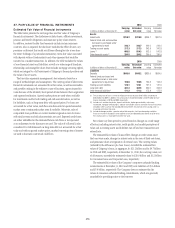
26. FAIR VALUE ELECTIONS
The Company may elect to report most financial instruments and certain
other items at fair value on an instrument-by-instrument basis with changes
in fair value reported in earnings. The election is made upon the acquisition
of an eligible financial asset, financial liability or firm commitment or
when certain specified reconsideration events occur. The fair value election
may not be revoked once an election is made. The changes in fair value are
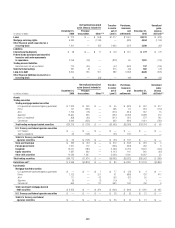
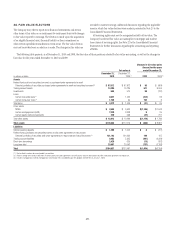
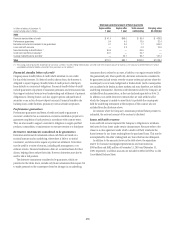
The following table presents, as of December 31, 2010 and 2009, the fair value of those positions selected for fair value accounting, as well as the changes in
fair value for the years ended December 31, 2010 and 2009:
Fair value at
Changes in fair value gains
(losses) for the years
ended December 31,
In millions of dollars
December 31,
2010
December 31,
2009 (1) 2010 2009 (1)
Assets
Federal funds sold and securities borrowed or purchased under agreements to resell
Selected portfolios of securities purchased under agreements to resell and securities borrowed (2) $ 87,512 $ 87,812 $ 56 $ (864)
Trading account assets 14,289 16,725 611 8,004
Investments 646 574 98 (137)
Loans
Certain Corporate loans (3) 2,627 1,405 (214) 62
Certain Consumer loans (3) 1,745 34 193 3
Total loans $ 4,372 $ 1,439 $ (21) $ 65
Other assets
MSRs $ 4,554 $ 6,530 $(1,146) $ 1,543
Certain mortgage loans (HFS) 7,230 3,338 935
Certain equity method investments 229 598 (37) 211
Total other assets $ 12,013 $ 10,466 $(1,174) $ 1,789
Total assets $118,832 $117,016 $ (430) $ 8,857
Liabilities
Interest-bearing deposits $ 1,265 $ 1,545 $ 8 $ (701)
Federal funds purchased and securities loaned or sold under agreements to repurchase
Selected portfolios of securities sold under agreements to repurchase and securities loaned (2) 121,193 104,030 149 155
Trading account liabilities 3,953 5,325 (481) (2,323)
Short-term borrowings 2,429 639 (13) (152)
Long-term debt 25,997 25,942 (737) (3,183)
Total $154,837 $137,481 $(1,074) $(6,204)
(1) Reclassified to conform to current period’s presentation.
(2) Reflects netting of the amounts due from securities purchased under agreements to resell and the amounts owed under securities sold under agreements to repurchase.
(3) Includes mortgage loans held by mortgage loan securitization VIEs consolidated upon the adoption of SFAS 167 on January 1, 2010.
recorded in current earnings. Additional discussion regarding the applicable
areas in which fair value elections were made is presented in Note 25 to the
Consolidated Financial Statements.
All servicing rights must now be recognized initially at fair value. The
Company has elected fair value accounting for its mortgage and student
loan classes of servicing rights. See Note 22 to the Consolidated Financial
Statements for further discussions regarding the accounting and reporting
of MSRs.