Citibank 2010 Annual Report Download - page 142
Download and view the complete annual report
Please find page 142 of the 2010 Citibank annual report below. You can navigate through the pages in the report by either clicking on the pages listed below, or by using the keyword search tool below to find specific information within the annual report.-
 1
1 -
2
-
3
-
4
-
5
-
6
-
7
-
8
-
9
-
10
-
11
-
12
-
13
-
14
-
15
-
16
-
17
-
18
-
19
-
20
-
21
-
22
-
23
-
24
-
25
-
26
-
27
-
28
-
29
-
30
-
31
-
32
-
33
-
34
-
35
-
36
-
37
-
38
-
39
-
40
-
41
-
42
-
43
-
44
-
45
-
46
-
47
-
48
-
49
-
50
-
51
-
52
-
53
-
54
-
55
-
56
-
57
-
58
-
59
-
60
-
61
-
62
-
63
-
64
-
65
-
66
-
67
-
68
-
69
-
70
-
71
-
72
-
73
-
74
-
75
-
76
-
77
-
78
-
79
-
80
-
81
-
82
-
83
-
84
-
85
-
86
-
87
-
88
-
89
-
90
-
91
-
92
-
93
-
94
-
95
-
96
-
97
-
98
-
99
-
100
-
101
-
102
-
103
-
104
-
105
-
106
-
107
-
108
-
109
-
110
-
111
-
112
-
113
-
114
-
115
-
116
-
117
-
118
-
119
-
120
-
121
-
122
-
123
-
124
-
125
-
126
-
127
-
128
-
129
-
130
-
131
-
 132
132 -
 133
133 -
 134
134 -
 135
135 -
 136
136 -
 137
137 -
 138
138 -
 139
139 -
 140
140 -
 141
141 -
 142
142 -
 143
143 -
 144
144 -
 145
145 -
 146
146 -
 147
147 -
 148
148 -
 149
149 -
 150
150 -
 151
151 -
 152
152 -
153
-
154
-
155
-
156
-
157
-
158
-
159
-
160
-
161
-
162
-
163
-
164
-
165
-
166
-
167
-
168
-
169
-
170
-
171
-
172
-
173
-
174
-
175
-
176
-
177
-
178
-
179
-
180
-
181
-
182
-
183
-
184
-
185
-
186
-
187
-
188
-
189
-
190
-
191
-
192
-
193
-
194
-
195
-
196
-
197
-
198
-
199
-
200
-
201
-
202
-
203
-
204
-
205
-
206
-
207
-
208
-
209
-
210
-
211
-
212
-
213
-
214
-
215
-
216
-
217
-
218
-
219
-
220
-
221
-
222
-
223
-
224
-
225
-
226
-
227
-
228
-
229
-
230
-
231
-
232
-
233
-
234
-
235
-
236
-
237
-
238
-
239
-
240
-
241
-
242
-
243
-
244
-
245
-
246
-
247
-
248
-
249
-
250
-
251
-
252
-
253
-
254
-
255
-
256
-
257
-
258
-
259
-
260
-
261
-
262
-
263
-
264
-
265
-
266
-
267
-
268
-
269
-
270
-
271
-
272
-
273
-
274
-
275
-
276
-
277
-
278
-
279
-
280
-
281
-
282
-
283
-
284
-
285
-
286
-
287
-
288
-
289
-
290
-
291
-
292
-
293
-
294
-
295
-
296
-
297
-
298
-
299
-
300
-
301
-
302
-
303
-
304
-
305
-
306
-
307
-
308
-
309
-
310
-
311
-
312
 |
 |

140
INCOME TAXES
Citigroup is subject to the income tax laws of the U.S., its states and local
municipalities and the foreign jurisdictions in which Citi operates. These tax
laws are complex and are subject to differing interpretations by the taxpayer
and the relevant governmental taxing authorities. In establishing a provision
for income tax expense, Citi must make judgments and interpretations about
the application of these inherently complex tax laws. Citi must also make
estimates about when in the future certain items will affect taxable income in
the various tax jurisdictions, both domestic and foreign.
Disputes over interpretations of the tax laws may be subject to review and
adjudication by the court systems of the various tax jurisdictions or may be
settled with the taxing authority upon audit. Deferred taxes are recorded for
the future consequences of events that have been recognized in the financial
statements or tax returns, based upon enacted tax laws and rates. Deferred
tax assets (DTAs) are recognized subject to management’s judgment that
realization is more likely than not.
At December 31, 2010, Citigroup had recorded net DTAs of approximately
$52.1 billion, an increase of $6.0 billion from $46.1 billion at December 31,
2009. Excluding the impact of the adoption of SFAS 166/167, the DTAs
increased $1.0 billion during 2010. The adoption of SFAS 166/167 on
January 1, 2010 resulted in an increase to the DTAs of approximately
$5.0 billion related to the loan losses recorded upon consolidation of Citi’s
credit card trusts.
Although realization is not assured, Citigroup believes that the realization
of the recognized net DTAs of $52.1 billion at December 31, 2010 is more
likely than not based upon expectations as to future taxable income in the
jurisdictions in which the DTAs arise, and based on available tax planning
strategies, as defined in ASC 740, Income Taxes, that would be implemented,
if necessary, to prevent a carryforward from expiring.
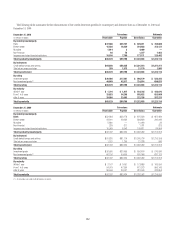
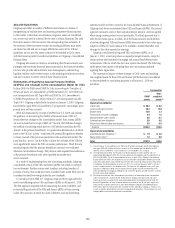
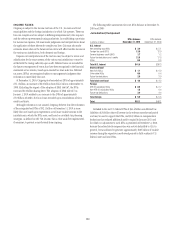
The following table summarizes Citi’s net DTAs balance at December 31,
2010 and 2009:
Jurisdiction/Component
In billions of dollars
DTAs balance
December 31, 2010
DTAs balance
December 31, 2009
U.S. federal
Net operating loss (NOL) $ 3.9 $ 5.1
Foreign tax credit (FTC) 13.9 12.0
General business credit (GBC) 1.7 1.2
Future tax deductions and credits 21.8 17.5
Other 0.3 0.5
Total U.S. federal $41.6 $36.3
State and local
New York NOLs $ 1.1 $ 0.9
Other state NOLs 0.6 0.4
Future tax deductions 2.9 3.0
Total state and local $ 4.6 $ 4.3
Foreign
APB 23 subsidiary NOLs $ 0.5 $ 0.7
Non-APB 23 subsidiary NOLs 1.5 0.4
Future tax deductions 3.9 4.4
Total foreign $ 5.9 $ 5.5
Total $52.1 $46.1
Included in the net U.S. federal DTAs of $41.6 billion are deferred tax
liabilities of $4 billion that will reverse in the relevant carryforward period
and may be used to support the DTAs, and $0.3 billion in compensation
deductions that reduced additional paid-in capital in January 2011 and
for which no adjustment to such DTAs is permitted at December 31, 2010,
because the related stock compensation was not yet deductible to Citi. In
general, Citi would need to generate approximately $105 billion of taxable
income during the respective carryforward periods to fully realize its U.S.
federal, state and local DTAs.