Citibank 2010 Annual Report Download - page 119
Download and view the complete annual report
Please find page 119 of the 2010 Citibank annual report below. You can navigate through the pages in the report by either clicking on the pages listed below, or by using the keyword search tool below to find specific information within the annual report.-
 1
1 -
2
-
3
-
4
-
5
-
6
-
7
-
8
-
9
-
10
-
11
-
12
-
13
-
14
-
15
-
16
-
17
-
18
-
19
-
20
-
21
-
22
-
23
-
24
-
25
-
26
-
27
-
28
-
29
-
30
-
31
-
32
-
33
-
34
-
35
-
36
-
37
-
38
-
39
-
40
-
41
-
42
-
43
-
44
-
45
-
46
-
47
-
48
-
49
-
50
-
51
-
52
-
53
-
54
-
55
-
56
-
57
-
58
-
59
-
60
-
61
-
62
-
63
-
64
-
65
-
66
-
67
-
68
-
69
-
70
-
71
-
72
-
73
-
74
-
75
-
76
-
77
-
78
-
79
-
80
-
81
-
82
-
83
-
84
-
85
-
86
-
87
-
88
-
89
-
90
-
91
-
92
-
93
-
94
-
95
-
96
-
97
-
98
-
99
-
100
-
101
-
102
-
103
-
104
-
105
-
106
-
107
-
108
-
 109
109 -
 110
110 -
 111
111 -
 112
112 -
 113
113 -
 114
114 -
 115
115 -
 116
116 -
 117
117 -
 118
118 -
 119
119 -
 120
120 -
 121
121 -
 122
122 -
 123
123 -
 124
124 -
 125
125 -
 126
126 -
 127
127 -
 128
128 -
 129
129 -
130
-
131
-
132
-
133
-
134
-
135
-
136
-
137
-
138
-
139
-
140
-
141
-
142
-
143
-
144
-
145
-
146
-
147
-
148
-
149
-
150
-
151
-
152
-
153
-
154
-
155
-
156
-
157
-
158
-
159
-
160
-
161
-
162
-
163
-
164
-
165
-
166
-
167
-
168
-
169
-
170
-
171
-
172
-
173
-
174
-
175
-
176
-
177
-
178
-
179
-
180
-
181
-
182
-
183
-
184
-
185
-
186
-
187
-
188
-
189
-
190
-
191
-
192
-
193
-
194
-
195
-
196
-
197
-
198
-
199
-
200
-
201
-
202
-
203
-
204
-
205
-
206
-
207
-
208
-
209
-
210
-
211
-
212
-
213
-
214
-
215
-
216
-
217
-
218
-
219
-
220
-
221
-
222
-
223
-
224
-
225
-
226
-
227
-
228
-
229
-
230
-
231
-
232
-
233
-
234
-
235
-
236
-
237
-
238
-
239
-
240
-
241
-
242
-
243
-
244
-
245
-
246
-
247
-
248
-
249
-
250
-
251
-
252
-
253
-
254
-
255
-
256
-
257
-
258
-
259
-
260
-
261
-
262
-
263
-
264
-
265
-
266
-
267
-
268
-
269
-
270
-
271
-
272
-
273
-
274
-
275
-
276
-
277
-
278
-
279
-
280
-
281
-
282
-
283
-
284
-
285
-
286
-
287
-
288
-
289
-
290
-
291
-
292
-
293
-
294
-
295
-
296
-
297
-
298
-
299
-
300
-
301
-
302
-
303
-
304
-
305
-
306
-
307
-
308
-
309
-
310
-
311
-
312
 |
 |
117
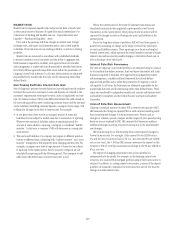
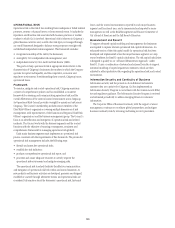
MARKET RISK
Market risk encompasses liquidity risk and price risk, both of which arise
in the normal course of business of a global financial intermediary. For
a discussion of funding and liquidity risk, see “Capital Resources and
Liquidity—Funding and Liquidity” above.
Price risk is the earnings risk from changes in interest rates, foreign
exchange rates, and equity and commodity prices, and in their implied
volatilities. Price risk arises in non-trading portfolios, as well as in trading
portfolios.
Market risks are measured in accordance with established standards
to ensure consistency across businesses and the ability to aggregate risk.
Each business is required to establish, with approval from Citi’s market
risk management, a market risk limit framework for identified risk factors
that clearly defines approved risk profiles and is within the parameters of
Citigroup’s overall risk tolerance. In all cases, the businesses are ultimately
responsible for the market risks they take and for remaining within their
defined limits.
Non-Trading Portfolios Interest Rate Risk
One of Citigroup’s primary business functions is providing financial products
that meet the needs of its customers. Loans and deposits are tailored to the
customers’ requirements with regard to tenor, index (if applicable) and rate
type. Net interest revenue (NIR) is the difference between the yield earned on
the non-trading portfolio assets (including customer loans) and the rate paid
on the liabilities (including customer deposits or company borrowings). NIR
is affected by changes in the level of interest rates. For example:
At any given time, there may be an unequal amount of assets and •
liabilities that are subject to market rates due to maturation or repricing.
Whenever the amount of liabilities subject to repricing exceeds the
amount of assets subject to repricing, a company is considered “liability
sensitive.” In this case, a company’s NIR will deteriorate in a rising rate
environment.
The assets and liabilities of a company may reprice at different speeds or •
mature at different times, subjecting both “liability-sensitive” and “asset-
sensitive” companies to NIR sensitivity from changing interest rates. For
example, a company may have a large amount of loans that are subject
to repricing in the current period, but the majority of deposits are not
scheduled for repricing until the following period. That company would
suffer from NIR deterioration if interest rates were to fall.
NIR in the current period is the result of customer transactions and
the related contractual rates originated in prior periods as well as new
transactions in the current period; those prior-period transactions will be
impacted by changes in rates on floating-rate assets and liabilities in the
current period.
Due to the long-term nature of portfolios, NIR will vary from quarter to
quarter even assuming no change in the shape or level of the yield curve
as assets and liabilities reprice. These repricings are a function of implied
forward interest rates, which represent the overall market’s estimate of future
interest rates and incorporate possible changes in the Federal Funds rate as
well as the shape of the yield curve.
Interest Rate Risk Governance
The risks in Citigroup’s non-traded portfolios are estimated using a common
set of standards that define, measure, limit and report the market risk. Each
business is required to establish, with approval from independent market
risk management, a market risk limit framework that clearly defines
approved risk profiles and is within the parameters of Citigroup’s overall
risk appetite. In all cases, the businesses are ultimately responsible for the
market risks they take and for remaining within their defined limits. These
limits are monitored by independent market risk, country and business Asset
and Liability Committees and the Global Finance and Asset and Liability
Committee.
Interest Rate Risk Measurement
Citigroup’s principal measure of risk to NIR is interest rate exposure (IRE).
IRE measures the change in expected NIR in each currency resulting solely
from unanticipated changes in forward interest rates. Factors such as
changes in volumes, spreads, margins and the impact of prior-period pricing
decisions are not captured by IRE. IRE assumes that businesses make no
additional changes in pricing or balances in response to the unanticipated
rate changes.
IRE tests the impact on NIR resulting from unanticipated changes in
forward interest rates. For example, if the current 90-day LIBOR rate is
3% and the one-year-forward rate is 5% (i.e., the estimated 90-day LIBOR
rate in one year), the +100 bps IRE scenario measures the impact on the
company’s NIR of a 100 bps instantaneous change in the 90-day LIBOR to
6% in one year.
The impact of changing prepayment rates on loan portfolios is
incorporated into the results. For example, in the declining interest rate
scenarios, it is assumed that mortgage portfolios prepay faster and income is
reduced. In addition, in a rising interest rate scenario, portions of the deposit
portfolio are assumed to experience rate increases that may be less than the
change in market interest rates.