Citibank 2010 Annual Report Download - page 93
Download and view the complete annual report
Please find page 93 of the 2010 Citibank annual report below. You can navigate through the pages in the report by either clicking on the pages listed below, or by using the keyword search tool below to find specific information within the annual report.-
 1
1 -
2
-
3
-
4
-
5
-
6
-
7
-
8
-
9
-
10
-
11
-
12
-
13
-
14
-
15
-
16
-
17
-
18
-
19
-
20
-
21
-
22
-
23
-
24
-
25
-
26
-
27
-
28
-
29
-
30
-
31
-
32
-
33
-
34
-
35
-
36
-
37
-
38
-
39
-
40
-
41
-
42
-
43
-
44
-
45
-
46
-
47
-
48
-
49
-
50
-
51
-
52
-
53
-
54
-
55
-
56
-
57
-
58
-
59
-
60
-
61
-
62
-
63
-
64
-
65
-
66
-
67
-
68
-
69
-
70
-
71
-
72
-
73
-
74
-
75
-
76
-
77
-
78
-
79
-
80
-
81
-
82
-
 83
83 -
 84
84 -
 85
85 -
 86
86 -
 87
87 -
 88
88 -
 89
89 -
 90
90 -
 91
91 -
 92
92 -
 93
93 -
 94
94 -
 95
95 -
 96
96 -
 97
97 -
 98
98 -
 99
99 -
 100
100 -
 101
101 -
 102
102 -
 103
103 -
104
-
105
-
106
-
107
-
108
-
109
-
110
-
111
-
112
-
113
-
114
-
115
-
116
-
117
-
118
-
119
-
120
-
121
-
122
-
123
-
124
-
125
-
126
-
127
-
128
-
129
-
130
-
131
-
132
-
133
-
134
-
135
-
136
-
137
-
138
-
139
-
140
-
141
-
142
-
143
-
144
-
145
-
146
-
147
-
148
-
149
-
150
-
151
-
152
-
153
-
154
-
155
-
156
-
157
-
158
-
159
-
160
-
161
-
162
-
163
-
164
-
165
-
166
-
167
-
168
-
169
-
170
-
171
-
172
-
173
-
174
-
175
-
176
-
177
-
178
-
179
-
180
-
181
-
182
-
183
-
184
-
185
-
186
-
187
-
188
-
189
-
190
-
191
-
192
-
193
-
194
-
195
-
196
-
197
-
198
-
199
-
200
-
201
-
202
-
203
-
204
-
205
-
206
-
207
-
208
-
209
-
210
-
211
-
212
-
213
-
214
-
215
-
216
-
217
-
218
-
219
-
220
-
221
-
222
-
223
-
224
-
225
-
226
-
227
-
228
-
229
-
230
-
231
-
232
-
233
-
234
-
235
-
236
-
237
-
238
-
239
-
240
-
241
-
242
-
243
-
244
-
245
-
246
-
247
-
248
-
249
-
250
-
251
-
252
-
253
-
254
-
255
-
256
-
257
-
258
-
259
-
260
-
261
-
262
-
263
-
264
-
265
-
266
-
267
-
268
-
269
-
270
-
271
-
272
-
273
-
274
-
275
-
276
-
277
-
278
-
279
-
280
-
281
-
282
-
283
-
284
-
285
-
286
-
287
-
288
-
289
-
290
-
291
-
292
-
293
-
294
-
295
-
296
-
297
-
298
-
299
-
300
-
301
-
302
-
303
-
304
-
305
-
306
-
307
-
308
-
309
-
310
-
311
-
312
 |
 |

91
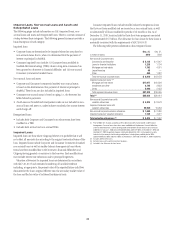
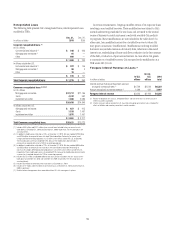
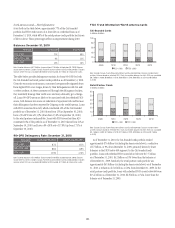
Renegotiated Loans
The following table presents Citi’s renegotiated loans, which represent loans
modified in TDRs.
In millions of dollars
Dec. 31,
2010
Dec. 31,
2009
Corporate renegotiated loans (1)
In U.S. offices
Commercial and industrial (2) $ 240 $ 203
Mortgage and real estate (3) 61 —
Other 699 —
$ 1,000 $ 203
In offices outside the U.S.
Commercial and industrial (2) $ 207 $ 145
Mortgage and real estate (3) 90 2
Other 18 —
$ 315 $ 147
Total Corporate renegotiated loans $ 1,315 $ 350
Consumer renegotiated loans (4)(5)(6)(7)
In U.S. offices
Mortgage and real estate $17,717 $11,165
Cards 4,747 992
Installment and other 1,986 2,689
$24,450 $14,846
In offices outside the U.S.
Mortgage and real estate $ 927 $ 415
Cards 1,159 1,461
Installment and other 1,875 1,401
$ 3,961 $ 3,277
Total Consumer renegotiated loans $28,411 $18,123
(1) Includes $553 million and $317 million of non-accrual loans included in the non-accrual assets
table above, at December 31, 2010 and December 31, 2009, respectively. The remaining loans are
accruing interest.
(2) In addition to modifications reflected as TDRs, at December 31, 2010, Citi also modified $190 million
and $416 million of commercial loans risk rated “Substandard Non-Performing” or worse (asset
category defined by banking regulators) in U.S. offices and in offices outside the U.S., respectively.
These modifications were not considered TDRs, because the modifications did not involve a
concession (a required element of a TDR for accounting purposes).
(3) In addition to modifications reflected as TDRs, at December 31, 2010, Citi also modified $695 million
and $155 million of commercial real estate loans risk rated “Substandard Non-Performing” or
worse (asset category defined by banking regulators) in U.S. offices and in offices outside the U.S.,
respectively. These modifications were not considered TDRs, because the modifications did not involve
a concession (a required element of a TDR for accounting purposes).
(4) Includes $2,751 million and $2,000 million of non-accrual loans included in the non-accrual assets
table above at December 31, 2010 and December 31, 2009, respectively. The remaining loans are
accruing interest.
(5) Includes $22 million of commercial real estate loans at December 31, 2010.
(6) Includes $177 million and $16 million of commercial loans at December 31, 2010 and December 31,
2009, respectively.
(7) Smaller-balance homogeneous loans were derived from Citi’s risk management systems.
In certain circumstances, Citigroup modifies certain of its corporate loans
involving a non-troubled borrower. These modifications are subject to Citi’s
normal underwriting standards for new loans and are made in the normal
course of business to match customers’ needs with available Citi products
or programs (these modifications are not included in the table above). In
other cases, loan modifications involve a troubled borrower to whom Citi
may grant a concession (modification). Modifications involving troubled
borrowers may include extension of maturity date, reduction in the stated
interest rate, rescheduling of future cash flows, reduction in the face amount
of the debt, or reduction of past accrued interest. In cases where Citi grants
a concession to a troubled borrower, Citi accounts for the modification as a
TDR under ASC 310-40.
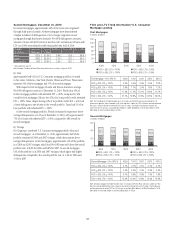
Foregone Interest Revenue on Loans (1)
In millions of dollars
In U.S.
offices
In non-
U.S.
offices
2010
total
Interest revenue that would have been accrued
at original contractual rates (2) $4,709 $1,593 $6,302
Amount recognized as interest revenue (2) 1,666 431 2,097
Foregone interest revenue $3,043 $1,162 $4,205
(1) Relates to Corporate non-accruals, renegotiated loans and Consumer loans on which accrual of
interest has been suspended.
(2) Interest revenue in offices outside the U.S. may reflect prevailing local interest rates, including the
effects of inflation and monetary correction in certain countries.