Citibank 2010 Annual Report Download - page 209
Download and view the complete annual report
Please find page 209 of the 2010 Citibank annual report below. You can navigate through the pages in the report by either clicking on the pages listed below, or by using the keyword search tool below to find specific information within the annual report.-
 1
1 -
2
-
3
-
4
-
5
-
6
-
7
-
8
-
9
-
10
-
11
-
12
-
13
-
14
-
15
-
16
-
17
-
18
-
19
-
20
-
21
-
22
-
23
-
24
-
25
-
26
-
27
-
28
-
29
-
30
-
31
-
32
-
33
-
34
-
35
-
36
-
37
-
38
-
39
-
40
-
41
-
42
-
43
-
44
-
45
-
46
-
47
-
48
-
49
-
50
-
51
-
52
-
53
-
54
-
55
-
56
-
57
-
58
-
59
-
60
-
61
-
62
-
63
-
64
-
65
-
66
-
67
-
68
-
69
-
70
-
71
-
72
-
73
-
74
-
75
-
76
-
77
-
78
-
79
-
80
-
81
-
82
-
83
-
84
-
85
-
86
-
87
-
88
-
89
-
90
-
91
-
92
-
93
-
94
-
95
-
96
-
97
-
98
-
99
-
100
-
101
-
102
-
103
-
104
-
105
-
106
-
107
-
108
-
109
-
110
-
111
-
112
-
113
-
114
-
115
-
116
-
117
-
118
-
119
-
120
-
121
-
122
-
123
-
124
-
125
-
126
-
127
-
128
-
129
-
130
-
131
-
132
-
133
-
134
-
135
-
136
-
137
-
138
-
139
-
140
-
141
-
142
-
143
-
144
-
145
-
146
-
147
-
148
-
149
-
150
-
151
-
152
-
153
-
154
-
155
-
156
-
157
-
158
-
159
-
160
-
161
-
162
-
163
-
164
-
165
-
166
-
167
-
168
-
169
-
170
-
171
-
172
-
173
-
174
-
175
-
176
-
177
-
178
-
179
-
180
-
181
-
182
-
183
-
184
-
185
-
186
-
187
-
188
-
189
-
190
-
191
-
192
-
193
-
194
-
195
-
196
-
197
-
198
-
 199
199 -
 200
200 -
 201
201 -
 202
202 -
 203
203 -
 204
204 -
 205
205 -
 206
206 -
 207
207 -
 208
208 -
 209
209 -
 210
210 -
 211
211 -
 212
212 -
 213
213 -
 214
214 -
 215
215 -
 216
216 -
 217
217 -
 218
218 -
 219
219 -
220
-
221
-
222
-
223
-
224
-
225
-
226
-
227
-
228
-
229
-
230
-
231
-
232
-
233
-
234
-
235
-
236
-
237
-
238
-
239
-
240
-
241
-
242
-
243
-
244
-
245
-
246
-
247
-
248
-
249
-
250
-
251
-
252
-
253
-
254
-
255
-
256
-
257
-
258
-
259
-
260
-
261
-
262
-
263
-
264
-
265
-
266
-
267
-
268
-
269
-
270
-
271
-
272
-
273
-
274
-
275
-
276
-
277
-
278
-
279
-
280
-
281
-
282
-
283
-
284
-
285
-
286
-
287
-
288
-
289
-
290
-
291
-
292
-
293
-
294
-
295
-
296
-
297
-
298
-
299
-
300
-
301
-
302
-
303
-
304
-
305
-
306
-
307
-
308
-
309
-
310
-
311
-
312
 |
 |

207
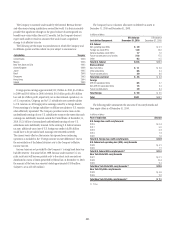
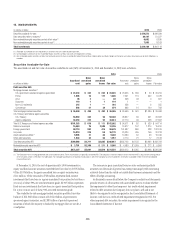
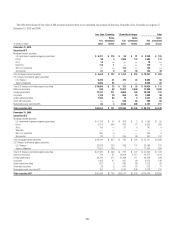
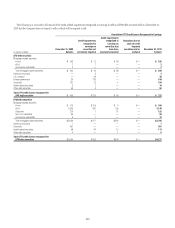
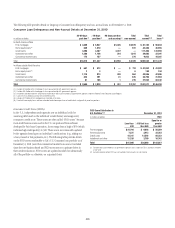
The table below shows the fair value of AFS securities that have been in an unrealized loss position for less than 12 months or for 12 months or longer as of
December 31, 2010 and 2009:
Less than 12 months 12 months or longer Total
In millions of dollars
Fair
value
Gross
unrealized
losses
Fair
value
Gross
unrealized
losses
Fair
value
Gross
unrealized
losses
December 31, 2010
Securities AFS
Mortgage-backed securities
U.S. government-sponsored agency guaranteed $ 8,321 $ 214 $ 38 $ 21 $ 8,359 $ 235
Prime 89 3 1,506 174 1,595 177
Alt-A 10 — — — 10 —
Subprime 118 1 — — 118 1
Non-U.S. residential — — 135 — 135 —
Commercial 81 9 53 30 134 39
Total mortgage-backed securities $ 8,619 $ 227 $ 1,732 $ 225 $ 10,351 $ 452
U.S. Treasury and federal agency securities
U.S. Treasury 9,229 21 725 35 9,954 56
Agency obligations 9,680 55 — — 9,680 55
Total U.S. Treasury and federal agency securities $18,909 $ 76 $ 725 $ 35 $ 19,634 $ 111
State and municipal 626 60 11,322 2,440 11,948 2,500
Foreign government 32,731 271 6,609 144 39,340 415
Corporate 1,128 30 860 29 1,988 59
Asset-backed securities 2,533 64 14 4 2,547 68
Other debt securities — — 559 60 559 60
Marketable equity securities AFS 68 3 2,039 208 2,107 211
Total securities AFS $64,614 $ 731 $23,860 $ 3,145 $ 88,474 $ 3,876
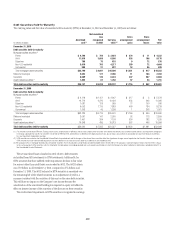
December 31, 2009
Securities AFS
Mortgage-backed securities
U.S. government-sponsored agency guaranteed $ 6,793 $ 47 $ 263 $ 3 $ 7,056 $ 50
Prime 5,074 905 228 27 5,302 932
Alt-A 106 — 35 4 141 4
Subprime — — — — — —
Non-U.S. residential 250 3 — — 250 3
Commercial 93 2 259 98 352 100
Total mortgage-backed securities $ 12,316 $ 957 $ 785 $ 132 $ 13,101 $ 1,089
U.S. Treasury and federal agency securities
U.S. Treasury 23,378 224 308 107 23,686 331
Agency obligations 17,957 208 7 — 17,964 208
Total U.S. Treasury and federal agency securities $41,335 $ 432 $ 315 $ 107 $ 41,650 $ 539
State and municipal 769 97 12,508 1,117 13,277 1,214
Foreign government 39,241 217 10,398 111 49,639 328
Corporate 1,165 47 907 99 2,072 146
Asset-backed securities 627 4 986 89 1,613 93
Other debt securities 28 2 647 75 675 77
Marketable equity securities AFS 102 4 2,526 208 2,628 212
Total securities AFS $ 95,583 $ 1,760 $29,072 $ 1,938 $124,655 $ 3,698