Citibank 2010 Annual Report Download - page 101
Download and view the complete annual report
Please find page 101 of the 2010 Citibank annual report below. You can navigate through the pages in the report by either clicking on the pages listed below, or by using the keyword search tool below to find specific information within the annual report.-
 1
1 -
2
-
3
-
4
-
5
-
6
-
7
-
8
-
9
-
10
-
11
-
12
-
13
-
14
-
15
-
16
-
17
-
18
-
19
-
20
-
21
-
22
-
23
-
24
-
25
-
26
-
27
-
28
-
29
-
30
-
31
-
32
-
33
-
34
-
35
-
36
-
37
-
38
-
39
-
40
-
41
-
42
-
43
-
44
-
45
-
46
-
47
-
48
-
49
-
50
-
51
-
52
-
53
-
54
-
55
-
56
-
57
-
58
-
59
-
60
-
61
-
62
-
63
-
64
-
65
-
66
-
67
-
68
-
69
-
70
-
71
-
72
-
73
-
74
-
75
-
76
-
77
-
78
-
79
-
80
-
81
-
82
-
83
-
84
-
85
-
86
-
87
-
88
-
89
-
90
-
 91
91 -
 92
92 -
 93
93 -
 94
94 -
 95
95 -
 96
96 -
 97
97 -
 98
98 -
 99
99 -
 100
100 -
 101
101 -
 102
102 -
 103
103 -
 104
104 -
 105
105 -
 106
106 -
 107
107 -
 108
108 -
 109
109 -
 110
110 -
 111
111 -
112
-
113
-
114
-
115
-
116
-
117
-
118
-
119
-
120
-
121
-
122
-
123
-
124
-
125
-
126
-
127
-
128
-
129
-
130
-
131
-
132
-
133
-
134
-
135
-
136
-
137
-
138
-
139
-
140
-
141
-
142
-
143
-
144
-
145
-
146
-
147
-
148
-
149
-
150
-
151
-
152
-
153
-
154
-
155
-
156
-
157
-
158
-
159
-
160
-
161
-
162
-
163
-
164
-
165
-
166
-
167
-
168
-
169
-
170
-
171
-
172
-
173
-
174
-
175
-
176
-
177
-
178
-
179
-
180
-
181
-
182
-
183
-
184
-
185
-
186
-
187
-
188
-
189
-
190
-
191
-
192
-
193
-
194
-
195
-
196
-
197
-
198
-
199
-
200
-
201
-
202
-
203
-
204
-
205
-
206
-
207
-
208
-
209
-
210
-
211
-
212
-
213
-
214
-
215
-
216
-
217
-
218
-
219
-
220
-
221
-
222
-
223
-
224
-
225
-
226
-
227
-
228
-
229
-
230
-
231
-
232
-
233
-
234
-
235
-
236
-
237
-
238
-
239
-
240
-
241
-
242
-
243
-
244
-
245
-
246
-
247
-
248
-
249
-
250
-
251
-
252
-
253
-
254
-
255
-
256
-
257
-
258
-
259
-
260
-
261
-
262
-
263
-
264
-
265
-
266
-
267
-
268
-
269
-
270
-
271
-
272
-
273
-
274
-
275
-
276
-
277
-
278
-
279
-
280
-
281
-
282
-
283
-
284
-
285
-
286
-
287
-
288
-
289
-
290
-
291
-
292
-
293
-
294
-
295
-
296
-
297
-
298
-
299
-
300
-
301
-
302
-
303
-
304
-
305
-
306
-
307
-
308
-
309
-
310
-
311
-
312
 |
 |
99
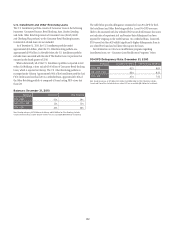
Interest Rate Risk Associated with Consumer Mortgage
Lending Activity
Citigroup originates and funds mortgage loans. As with all other lending
activity, this exposes Citigroup to several risks, including credit, liquidity and
interest rate risks. To minimize credit and liquidity risk, Citigroup sells most
of the mortgage loans it originates, but retains the servicing rights. These
sale transactions create an intangible asset referred to as MSRs, which expose
Citi to interest rate risk. For example, the fair value of MSRs declines with
increased prepayments, and lower interest rates are generally one factor that
tends to lead to increased prepayments.
In managing this risk, Citigroup hedges a significant portion of the value
of its MSRs. However, since the change in the value of these hedges does
not perfectly match the change in the value of the MSRs, Citigroup is still
exposed to what is commonly referred to as “basis risk.” Citigroup manages
this risk by reviewing the mix of the various hedges on a daily basis.
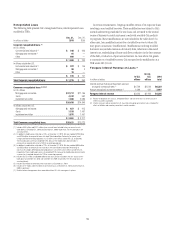
Citigroup’s MSRs totaled $4.554 billion and $6.530 billion at
December 31, 2010 and December 31, 2009, respectively. For additional
information on Citi’s MSRs, see Notes 18 and 22 to the Consolidated
Financial Statements.
As part of its mortgage lending activity, Citigroup commonly enters into
purchase commitments to fund residential mortgage loans at specific interest
rates within a given period of time, generally up to 60 days after the rate
has been set. If the resulting loans will be classified as loans held-for-sale,
Citigroup accounts for the commitments as derivatives. Accordingly, changes
in the fair value of these commitments, which are driven by changes in
mortgage interest rates, are recognized in current earnings after taking into
consideration the likelihood that the commitment will be funded.
Citigroup hedges its exposure to the change in the value of these commitments.
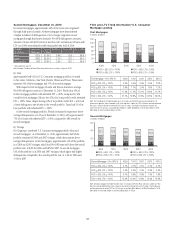
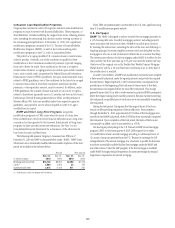
North America Cards
Overview
Citi’s North America cards portfolio consists of its Citi-branded and retail
partner cards portfolios reported in Citicorp—Regional Consumer
Banking and Citi Holdings—Local Consumer Lending, respectively. As of
December 31, 2010, the Citi-branded portfolio totaled $78 billion, while the
retail partner cards portfolio was $46 billion.
Beginning as early as 2008, Citi actively pursued loss mitigation
measures, such as stricter underwriting standards for new accounts and
closing high-risk accounts, in each of its Citi-branded and retail partner
cards portfolios. As a result of these efforts, higher risk customers have either
had their available lines of credit reduced or their accounts closed. On a net
basis, end-of-period open accounts are down 8% in Citi-branded cards and
11% in retail partner cards, each versus prior-year levels.
See “Consumer Loan Modification Programs” below for a discussion of
Citi’s modification programs for card loans.
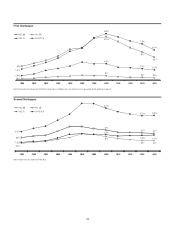
Cards Quarterly Trends—Delinquencies and Net Credit Losses
The following charts detail the quarterly trends in delinquencies and net
credit losses for Citigroup’s North America Citi-branded and retail partner
cards portfolios. Trends for both Citi-branded and retail partner cards
continued to reflect the improving credit quality of these portfolios. In Citi-
branded cards, delinquencies declined for the fourth consecutive quarter to
$1.6 billion, an improvement of 12% from the prior quarter. Net credit losses
declined for the third consecutive quarter to $1.7 billion, 11% lower than the
prior quarter. In retail partner cards, delinquencies declined for the fourth
consecutive quarter while net credit losses declined for the sixth consecutive
quarter. For both portfolios, early-stage delinquencies also continued to
show improvement.