Citibank 2010 Annual Report Download - page 121
Download and view the complete annual report
Please find page 121 of the 2010 Citibank annual report below. You can navigate through the pages in the report by either clicking on the pages listed below, or by using the keyword search tool below to find specific information within the annual report.-
 1
1 -
2
-
3
-
4
-
5
-
6
-
7
-
8
-
9
-
10
-
11
-
12
-
13
-
14
-
15
-
16
-
17
-
18
-
19
-
20
-
21
-
22
-
23
-
24
-
25
-
26
-
27
-
28
-
29
-
30
-
31
-
32
-
33
-
34
-
35
-
36
-
37
-
38
-
39
-
40
-
41
-
42
-
43
-
44
-
45
-
46
-
47
-
48
-
49
-
50
-
51
-
52
-
53
-
54
-
55
-
56
-
57
-
58
-
59
-
60
-
61
-
62
-
63
-
64
-
65
-
66
-
67
-
68
-
69
-
70
-
71
-
72
-
73
-
74
-
75
-
76
-
77
-
78
-
79
-
80
-
81
-
82
-
83
-
84
-
85
-
86
-
87
-
88
-
89
-
90
-
91
-
92
-
93
-
94
-
95
-
96
-
97
-
98
-
99
-
100
-
101
-
102
-
103
-
104
-
105
-
106
-
107
-
108
-
109
-
110
-
 111
111 -
 112
112 -
 113
113 -
 114
114 -
 115
115 -
 116
116 -
 117
117 -
 118
118 -
 119
119 -
 120
120 -
 121
121 -
 122
122 -
 123
123 -
 124
124 -
 125
125 -
 126
126 -
 127
127 -
 128
128 -
 129
129 -
 130
130 -
 131
131 -
132
-
133
-
134
-
135
-
136
-
137
-
138
-
139
-
140
-
141
-
142
-
143
-
144
-
145
-
146
-
147
-
148
-
149
-
150
-
151
-
152
-
153
-
154
-
155
-
156
-
157
-
158
-
159
-
160
-
161
-
162
-
163
-
164
-
165
-
166
-
167
-
168
-
169
-
170
-
171
-
172
-
173
-
174
-
175
-
176
-
177
-
178
-
179
-
180
-
181
-
182
-
183
-
184
-
185
-
186
-
187
-
188
-
189
-
190
-
191
-
192
-
193
-
194
-
195
-
196
-
197
-
198
-
199
-
200
-
201
-
202
-
203
-
204
-
205
-
206
-
207
-
208
-
209
-
210
-
211
-
212
-
213
-
214
-
215
-
216
-
217
-
218
-
219
-
220
-
221
-
222
-
223
-
224
-
225
-
226
-
227
-
228
-
229
-
230
-
231
-
232
-
233
-
234
-
235
-
236
-
237
-
238
-
239
-
240
-
241
-
242
-
243
-
244
-
245
-
246
-
247
-
248
-
249
-
250
-
251
-
252
-
253
-
254
-
255
-
256
-
257
-
258
-
259
-
260
-
261
-
262
-
263
-
264
-
265
-
266
-
267
-
268
-
269
-
270
-
271
-
272
-
273
-
274
-
275
-
276
-
277
-
278
-
279
-
280
-
281
-
282
-
283
-
284
-
285
-
286
-
287
-
288
-
289
-
290
-
291
-
292
-
293
-
294
-
295
-
296
-
297
-
298
-
299
-
300
-
301
-
302
-
303
-
304
-
305
-
306
-
307
-
308
-
309
-
310
-
311
-
312
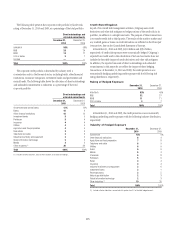
 |
 |
119
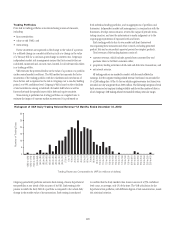
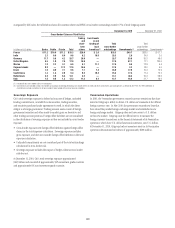
Trading Portfolios
Price risk in trading portfolios is monitored using a series of measures,
including:
factor sensitivities; •
value-at-risk (V• AR); and
stress testing. •
Factor sensitivities are expressed as the change in the value of a position
for a defined change in a market risk factor, such as a change in the value
of a Treasury bill for a one-basis-point change in interest rates. Citigroup’s
independent market risk management ensures that factor sensitivities are
calculated, monitored and, in most cases, limited, for all relevant risks taken
in a trading portfolio.
VAR estimates the potential decline in the value of a position or a portfolio
under normal market conditions. The VAR method incorporates the factor
sensitivities of the trading portfolio with the volatilities and correlations of
those factors and is expressed as the risk to Citigroup over a one-day holding
period, at a 99% confidence level. Citigroup’s VAR is based on the volatilities
of and correlations among a multitude of market risk factors as well as
factors that track the specific issuer risk in debt and equity securities.
Stress testing is performed on trading portfolios on a regular basis to
estimate the impact of extreme market movements. It is performed on
both individual trading portfolios, and on aggregations of portfolios and
businesses. Independent market risk management, in conjunction with the
businesses, develops stress scenarios, reviews the output of periodic stress-
testing exercises, and uses the information to make judgments as to the
ongoing appropriateness of exposure levels and limits.
Each trading portfolio has its own market risk limit framework
encompassing these measures and other controls, including permitted
product lists and a new product approval process for complex products.
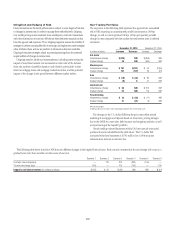
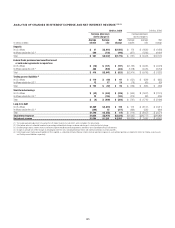
Total revenues of the trading business consist of:
customer revenue, which includes spreads from customer flow and •
positions taken to facilitate customer orders;
proprietary trading activities in both cash and derivative transactions; and •
net interest revenue.•
All trading positions are marked to market, with the result reflected in
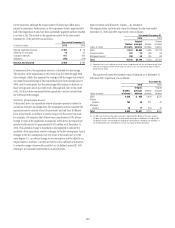
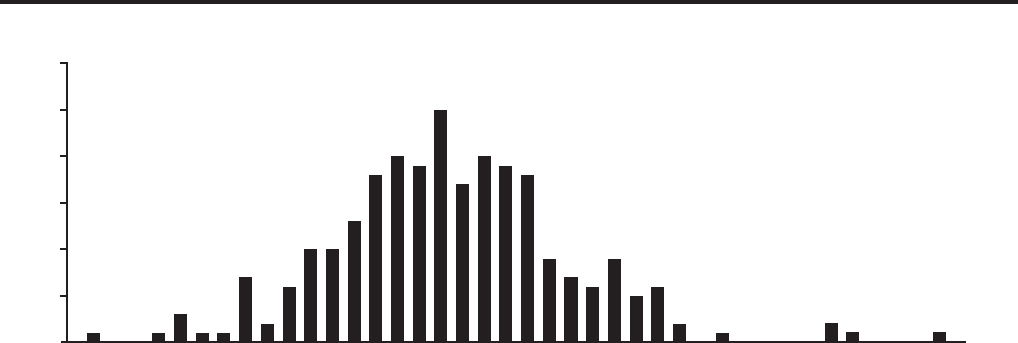
earnings. In 2010, negative trading-related revenue (net losses) was recorded for
55 of 260 trading days. Of the 55 days on which negative revenue (net losses) was
recorded, one day was greater than $100 million. The following histogram of total
daily revenue or loss captures trading volatility and shows the number of days in
which Citigroup’s VAR trading-related revenues fell within particular ranges.
0
5
10
15
20
25
30
(120) to (110)
Trading Revenues Comparable to VAR (in millions of dollars)
(130) to (120)
(10) to 0
(20) to (10)
(30) to (20)
(40) to (30)
(50) to (40)
(60) to (50)
(70) to (60)
(80) to (70)
(90) to (80)
(100) to (90)
(110) to (100)
190 to 200
200 to 210
180 to 190
170 to 180
160 to 170
240 to 250
250 to 260
230 to 240
220 to 230
210 to 220
0 to 10
10 to 20
20 to 30
30 to 40
40 to 50
50 to 60
60 to 70
70 to 80
80 to 90
90 to 100
100 to 110
110 to 120
120 to 130
130 to 140
140 to 150
150 to 160
260 to 470
Number of Trading Days
Histogram of VAR Daily-Trading Related Revenue—12 Months Ended December 31, 2010
to confirm that the daily market value losses in excess of a 99% confidence
level occur, on average, only 1% of the time. The VAR calculation for the
hypothetical test portfolios, with different degrees of risk concentration, meets
this statistical criterion.
Citigroup periodically performs extensive back-testing of many hypothetical
test portfolios as one check of the accuracy of its VAR. Back-testing is the
process in which the daily VAR of a portfolio is compared to the actual daily
change in the market value of its transactions. Back-testing is conducted