Citibank 2010 Annual Report Download - page 40
Download and view the complete annual report
Please find page 40 of the 2010 Citibank annual report below. You can navigate through the pages in the report by either clicking on the pages listed below, or by using the keyword search tool below to find specific information within the annual report.-
 1
1 -
2
-
3
-
4
-
5
-
6
-
7
-
8
-
9
-
10
-
11
-
12
-
13
-
14
-
15
-
16
-
17
-
18
-
19
-
20
-
21
-
22
-
23
-
24
-
25
-
26
-
27
-
28
-
29
-
 30
30 -
 31
31 -
 32
32 -
 33
33 -
 34
34 -
 35
35 -
 36
36 -
 37
37 -
 38
38 -
 39
39 -
 40
40 -
 41
41 -
 42
42 -
 43
43 -
 44
44 -
 45
45 -
 46
46 -
 47
47 -
 48
48 -
 49
49 -
 50
50 -
51
-
52
-
53
-
54
-
55
-
56
-
57
-
58
-
59
-
60
-
61
-
62
-
63
-
64
-
65
-
66
-
67
-
68
-
69
-
70
-
71
-
72
-
73
-
74
-
75
-
76
-
77
-
78
-
79
-
80
-
81
-
82
-
83
-
84
-
85
-
86
-
87
-
88
-
89
-
90
-
91
-
92
-
93
-
94
-
95
-
96
-
97
-
98
-
99
-
100
-
101
-
102
-
103
-
104
-
105
-
106
-
107
-
108
-
109
-
110
-
111
-
112
-
113
-
114
-
115
-
116
-
117
-
118
-
119
-
120
-
121
-
122
-
123
-
124
-
125
-
126
-
127
-
128
-
129
-
130
-
131
-
132
-
133
-
134
-
135
-
136
-
137
-
138
-
139
-
140
-
141
-
142
-
143
-
144
-
145
-
146
-
147
-
148
-
149
-
150
-
151
-
152
-
153
-
154
-
155
-
156
-
157
-
158
-
159
-
160
-
161
-
162
-
163
-
164
-
165
-
166
-
167
-
168
-
169
-
170
-
171
-
172
-
173
-
174
-
175
-
176
-
177
-
178
-
179
-
180
-
181
-
182
-
183
-
184
-
185
-
186
-
187
-
188
-
189
-
190
-
191
-
192
-
193
-
194
-
195
-
196
-
197
-
198
-
199
-
200
-
201
-
202
-
203
-
204
-
205
-
206
-
207
-
208
-
209
-
210
-
211
-
212
-
213
-
214
-
215
-
216
-
217
-
218
-
219
-
220
-
221
-
222
-
223
-
224
-
225
-
226
-
227
-
228
-
229
-
230
-
231
-
232
-
233
-
234
-
235
-
236
-
237
-
238
-
239
-
240
-
241
-
242
-
243
-
244
-
245
-
246
-
247
-
248
-
249
-
250
-
251
-
252
-
253
-
254
-
255
-
256
-
257
-
258
-
259
-
260
-
261
-
262
-
263
-
264
-
265
-
266
-
267
-
268
-
269
-
270
-
271
-
272
-
273
-
274
-
275
-
276
-
277
-
278
-
279
-
280
-
281
-
282
-
283
-
284
-
285
-
286
-
287
-
288
-
289
-
290
-
291
-
292
-
293
-
294
-
295
-
296
-
297
-
298
-
299
-
300
-
301
-
302
-
303
-
304
-
305
-
306
-
307
-
308
-
309
-
310
-
311
-
312
 |
 |

38
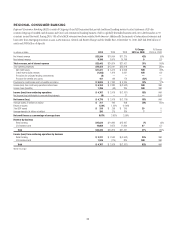
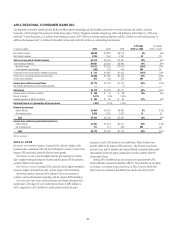
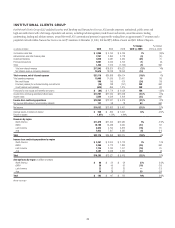
LATIN AMERICA REGIONAL CONSUMER BANKING
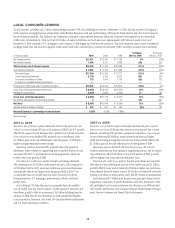
Latin America Regional Consumer Banking (LATAM RCB) provides traditional banking and Citi-branded card services to retail customers and small to mid-
size businesses, with the largest presence in Mexico and Brazil. LATAM RCB includes branch networks throughout Latin America as well as Banco Nacional de
Mexico, or Banamex, Mexico’s second largest bank, with over 1,700 branches. At December 31, 2010, LATAM RCB had 2,190 retail branches, with 26.6 million
customer accounts, $21.3 billion in retail banking loan balances and $42.6 billion in average deposits. In addition, the business had 12.5 million Citi-branded
card accounts with $13.4 billion in outstanding loan balances.
In millions of dollars 2010 2009 2008
% Change
2010 vs. 2009
% Change
2009 vs. 2008
Net interest revenue $6,009 $5,399 $ 6,604 11% (18)%
Non-interest revenue 2,718 2,518 2,884 8(13)
Total revenues, net of interest expense $8,727 $7,917 $ 9,488 10% (17)%
Total operating expenses $5,060 $4,438 $ 9,123 14% (51)%
Net credit losses $1,867 $2,433 $ 2,204 (23)% 10%
Credit reserve build (release) (826) 462 1,116 NM (59)
Provision for benefits and claims 127 114 172 11 (34)
Provisions for loan losses and for benefits and claims $1,168 $3,009 $ 3,492 (61)% (14)%
Income (loss) from continuing operations before taxes $2,499 $ 470 $(3,127) NM NM
Income taxes (benefits) 614 (55) (44) NM (25)%
Income (loss) from continuing operations $1,885 $ 525 $(3,083) NM NM
Net (loss) attributable to noncontrolling interests (8) — — NM —
Net income (loss) $1,893 $ 525 $(3,083) NM NM
Average assets (in billions of dollars) $ 74 66 $ 83 12% (20)%
Return on assets 2.56% 0.80% (3.72)%
Average deposits (in billions of dollars) $ 40 $ 36 $ 40 11% (10)%
Net credit losses as a percentage of average loans 5.79% 8.52% 7.05%
Revenue by business
Retail banking $5,075 $4,435 $ 4,807 14% (8)%
Citi-branded cards 3,652 3,482 4,681 5(26)
Total $8,727 $7,917 $ 9,488 10% (17)%
Income (loss) from continuing operations by business
Retail banking $1,039 $ 749 $(3,235) 39% NM
Citi-branded cards 846 (224) 152 NM NM
Total $1,885 $ 525 $(3,083) NM NM
NM Not meaningful
2010 vs. 2009
Revenues, net of interest expense increased 10%, driven by higher loan
volumes and higher investment assets under management in the retail
business, as well as the impact of FX translation.
Net interest revenue increased 11%, driven by higher loan volumes,
primarily in the retail business, and FX translation impact offset by spread
compression.
Non-interest revenue increased 8%, driven by higher branded cards fee
income from increased customer activity.
Operating expenses increased 14% as compared to the prior year,
primarily driven by investments and the impact of FX translation. The
increase in 2010 was primarily driven by an increase in transaction volumes,
higher investment spending and FX translation.
Provisions for loan losses and for benefits and claims decreased 61%,
primarily reflecting loan loss reserve releases of $826 million compared to a
build of $426 million in the prior year. This decrease resulted from improved
credit conditions, improved portfolio quality and lower net credit losses in
the branded cards portfolio driven by Mexico, partially offset by higher credit
costs attributable to higher volumes, particularly as the year progressed.