Citibank 2010 Annual Report Download - page 124
Download and view the complete annual report
Please find page 124 of the 2010 Citibank annual report below. You can navigate through the pages in the report by either clicking on the pages listed below, or by using the keyword search tool below to find specific information within the annual report.-
 1
1 -
2
-
3
-
4
-
5
-
6
-
7
-
8
-
9
-
10
-
11
-
12
-
13
-
14
-
15
-
16
-
17
-
18
-
19
-
20
-
21
-
22
-
23
-
24
-
25
-
26
-
27
-
28
-
29
-
30
-
31
-
32
-
33
-
34
-
35
-
36
-
37
-
38
-
39
-
40
-
41
-
42
-
43
-
44
-
45
-
46
-
47
-
48
-
49
-
50
-
51
-
52
-
53
-
54
-
55
-
56
-
57
-
58
-
59
-
60
-
61
-
62
-
63
-
64
-
65
-
66
-
67
-
68
-
69
-
70
-
71
-
72
-
73
-
74
-
75
-
76
-
77
-
78
-
79
-
80
-
81
-
82
-
83
-
84
-
85
-
86
-
87
-
88
-
89
-
90
-
91
-
92
-
93
-
94
-
95
-
96
-
97
-
98
-
99
-
100
-
101
-
102
-
103
-
104
-
105
-
106
-
107
-
108
-
109
-
110
-
111
-
112
-
113
-
 114
114 -
 115
115 -
 116
116 -
 117
117 -
 118
118 -
 119
119 -
 120
120 -
 121
121 -
 122
122 -
 123
123 -
 124
124 -
 125
125 -
 126
126 -
 127
127 -
 128
128 -
 129
129 -
 130
130 -
 131
131 -
 132
132 -
 133
133 -
 134
134 -
135
-
136
-
137
-
138
-
139
-
140
-
141
-
142
-
143
-
144
-
145
-
146
-
147
-
148
-
149
-
150
-
151
-
152
-
153
-
154
-
155
-
156
-
157
-
158
-
159
-
160
-
161
-
162
-
163
-
164
-
165
-
166
-
167
-
168
-
169
-
170
-
171
-
172
-
173
-
174
-
175
-
176
-
177
-
178
-
179
-
180
-
181
-
182
-
183
-
184
-
185
-
186
-
187
-
188
-
189
-
190
-
191
-
192
-
193
-
194
-
195
-
196
-
197
-
198
-
199
-
200
-
201
-
202
-
203
-
204
-
205
-
206
-
207
-
208
-
209
-
210
-
211
-
212
-
213
-
214
-
215
-
216
-
217
-
218
-
219
-
220
-
221
-
222
-
223
-
224
-
225
-
226
-
227
-
228
-
229
-
230
-
231
-
232
-
233
-
234
-
235
-
236
-
237
-
238
-
239
-
240
-
241
-
242
-
243
-
244
-
245
-
246
-
247
-
248
-
249
-
250
-
251
-
252
-
253
-
254
-
255
-
256
-
257
-
258
-
259
-
260
-
261
-
262
-
263
-
264
-
265
-
266
-
267
-
268
-
269
-
270
-
271
-
272
-
273
-
274
-
275
-
276
-
277
-
278
-
279
-
280
-
281
-
282
-
283
-
284
-
285
-
286
-
287
-
288
-
289
-
290
-
291
-
292
-
293
-
294
-
295
-
296
-
297
-
298
-
299
-
300
-
301
-
302
-
303
-
304
-
305
-
306
-
307
-
308
-
309
-
310
-
311
-
312
 |
 |

122
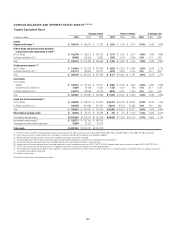
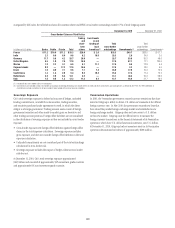
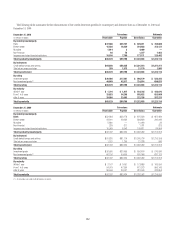
AVERAGE BALANCES AND INTEREST RATES—ASSETS (1)(2)(3)(4)
Taxable Equivalent Basis
Average volume Interest revenue % Average rate
In millions of dollars 2010 2009 2008 2010 2009 2008 2010 2009 2008
Assets
Deposits with banks (5) $ 166,120 $ 186,841 $ 77,200 $ 1,252 $ 1,478 $ 3,074 0.75% 0.79% 3.98%
Federal funds sold and securities borrowed
or purchased under agreements to resell (6)
In U.S. offices $ 162,799 $ 138,579 $ 164,732 $ 1,774 $ 1,975 $ 5,071 1.09% 1.43% 3.08%
In offices outside the U.S. (5) 86,926 63,909 73,833 1,382 1,109 4,079 1.59 1.74 5.52
Total $ 249,725 $ 202,488 $ 238,565 $ 3,156 $ 3,084 $ 9,150 1.26% 1.52% 3.84%
Trading account assets (7)(8)
In U.S. offices $ 128,443 $ 140,233 $ 221,455 $ 4,352 $ 6,975 $ 12,646 3.39% 4.97% 5.71%
In offices outside the U.S. (5) 151,717 126,309 151,071 3,819 3,879 5,115 2.52 3.07 3.39
Total $ 280,160 $ 266,542 $ 372,526 $ 8,171 $ 10,854 $ 17,761 2.92% 4.07% 4.77%
Investments
In U.S. offices
Taxable $ 169,218 $ 124,404 $ 112,071 $ 4,806 $ 6,208 $ 4,846 2.84% 4.99% 4.32%
Exempt from U.S. income tax 14,876 16,489 13,584 1,152 1,347 894 7.75 8.17 6.58
In offices outside the U.S. (5) 136,713 118,988 94,725 5,678 6,047 5,259 4.15 5.08 5.55
Total $ 320,807 $ 259,881 $ 220,380 $ 11,636 $ 13,602 $ 10,999 3.63% 5.23% 4.99%
Loans (net of unearned income) (9)
In U.S. offices $ 430,685 $ 378,937 $ 416,867 $ 34,773 $ 24,748 $ 30,973 8.07% 6.53% 7.43%
In offices outside the U.S. (5) 254,168 267,683 317,657 20,312 22,766 31,398 7.99 8.50 9.88
Total $ 684,853 $ 646,620 $ 734,524 $ 55,085 $ 47,514 $ 62,371 8.04% 7.35% 8.49%
Other interest-earning assets $ 50,936 $ 49,707 $ 94,123 $ 735 $ 774 $ 3,775 1.44% 1.56% 4.01%
Total interest-earning assets $1,752,601 $1,612,079 $1,737,318 $ 80,035 $ 77,306 $107,130 4.57% 4.80% 6.17%
Non-interest-earning assets (7) $ 226,271 $ 264,165 $ 383,150
Total assets from discontinued operations 18,989 15,137 47,010
Total assets $1,997,861 $1,891,381 $2,167,478
(1) Net interest revenue includes the taxable equivalent adjustments (based on the U.S. federal statutory tax rate of 35%) of $519 million, $692 million, and $699 million for 2010, 2009, and 2008, respectively.
(2) Interest rates and amounts include the effects of risk management activities associated with the respective asset and liability categories.
(3) Monthly or quarterly averages have been used by certain subsidiaries where daily averages are unavailable.
(4) Detailed average volume, interest revenue and interest expense exclude discontinued operations. See Note 3 to the Consolidated Financial Statements.
(5) Average rates reflect prevailing local interest rates, including inflationary effects and monetary corrections in certain countries.
(6) Average volumes of securities borrowed or purchased under agreements to resell are reported net pursuant to FIN 41 (ASC 210-20-45). However, Interest revenue excludes the impact of FIN 41 (ASC 210-20-45).
(7) The fair value carrying amounts of derivative contracts are reported in non-interest-earning assets and other non-interest-bearing liabilities.
(8) Interest expense on Trading account liabilities of ICG is reported as a reduction of Interest Revenue. Interest revenue and interest expense on cash collateral positions are reported in interest on Trading account assets
and Trading account liabilities, respectively.
(9) Includes cash-basis loans.
Reclassified to conform to the current period’s presentation.