Citibank 2010 Annual Report Download - page 208
Download and view the complete annual report
Please find page 208 of the 2010 Citibank annual report below. You can navigate through the pages in the report by either clicking on the pages listed below, or by using the keyword search tool below to find specific information within the annual report.-
 1
1 -
2
-
3
-
4
-
5
-
6
-
7
-
8
-
9
-
10
-
11
-
12
-
13
-
14
-
15
-
16
-
17
-
18
-
19
-
20
-
21
-
22
-
23
-
24
-
25
-
26
-
27
-
28
-
29
-
30
-
31
-
32
-
33
-
34
-
35
-
36
-
37
-
38
-
39
-
40
-
41
-
42
-
43
-
44
-
45
-
46
-
47
-
48
-
49
-
50
-
51
-
52
-
53
-
54
-
55
-
56
-
57
-
58
-
59
-
60
-
61
-
62
-
63
-
64
-
65
-
66
-
67
-
68
-
69
-
70
-
71
-
72
-
73
-
74
-
75
-
76
-
77
-
78
-
79
-
80
-
81
-
82
-
83
-
84
-
85
-
86
-
87
-
88
-
89
-
90
-
91
-
92
-
93
-
94
-
95
-
96
-
97
-
98
-
99
-
100
-
101
-
102
-
103
-
104
-
105
-
106
-
107
-
108
-
109
-
110
-
111
-
112
-
113
-
114
-
115
-
116
-
117
-
118
-
119
-
120
-
121
-
122
-
123
-
124
-
125
-
126
-
127
-
128
-
129
-
130
-
131
-
132
-
133
-
134
-
135
-
136
-
137
-
138
-
139
-
140
-
141
-
142
-
143
-
144
-
145
-
146
-
147
-
148
-
149
-
150
-
151
-
152
-
153
-
154
-
155
-
156
-
157
-
158
-
159
-
160
-
161
-
162
-
163
-
164
-
165
-
166
-
167
-
168
-
169
-
170
-
171
-
172
-
173
-
174
-
175
-
176
-
177
-
178
-
179
-
180
-
181
-
182
-
183
-
184
-
185
-
186
-
187
-
188
-
189
-
190
-
191
-
192
-
193
-
194
-
195
-
196
-
197
-
 198
198 -
 199
199 -
 200
200 -
 201
201 -
 202
202 -
 203
203 -
 204
204 -
 205
205 -
 206
206 -
 207
207 -
 208
208 -
 209
209 -
 210
210 -
 211
211 -
 212
212 -
 213
213 -
 214
214 -
 215
215 -
 216
216 -
 217
217 -
 218
218 -
219
-
220
-
221
-
222
-
223
-
224
-
225
-
226
-
227
-
228
-
229
-
230
-
231
-
232
-
233
-
234
-
235
-
236
-
237
-
238
-
239
-
240
-
241
-
242
-
243
-
244
-
245
-
246
-
247
-
248
-
249
-
250
-
251
-
252
-
253
-
254
-
255
-
256
-
257
-
258
-
259
-
260
-
261
-
262
-
263
-
264
-
265
-
266
-
267
-
268
-
269
-
270
-
271
-
272
-
273
-
274
-
275
-
276
-
277
-
278
-
279
-
280
-
281
-
282
-
283
-
284
-
285
-
286
-
287
-
288
-
289
-
290
-
291
-
292
-
293
-
294
-
295
-
296
-
297
-
298
-
299
-
300
-
301
-
302
-
303
-
304
-
305
-
306
-
307
-
308
-
309
-
310
-
311
-
312
 |
 |

206
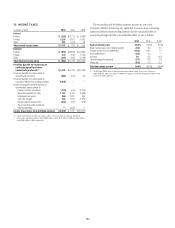
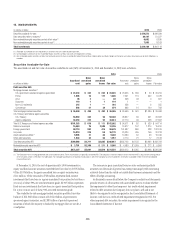
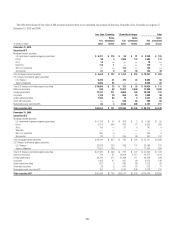
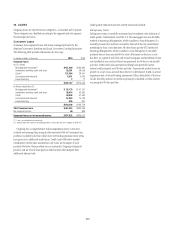
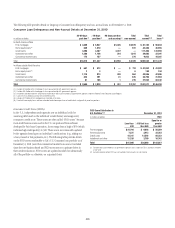
15. INVESTMENTS
In millions of dollars 2010 2009
Securities available-for-sale $274,572 $239,599
Debt securities held-to-maturity (1) 29,107 51,527
Non-marketable equity securities carried at fair value (2) 6,602 6,830
Non-marketable equity securities carried at cost (3) 7,883 8,163
Total investments $318,164 $306,119
(1) Recorded at amortized cost less impairment on securities that have credit-related impairment.
(2) Unrealized gains and losses for non-marketable equity securities carried at fair value are recognized in earnings.
(3) Non-marketable equity securities carried at cost primarily consist of shares issued by the Federal Reserve Bank, Federal Home Loan Bank, foreign central banks and various clearing houses of which Citigroup is a
member.
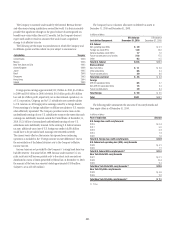
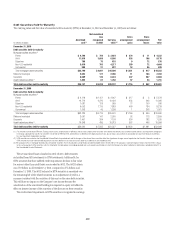
Securities Available-for-Sale
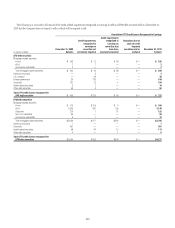
The amortized cost and fair value of securities available-for-sale (AFS) at December 31, 2010 and December 31, 2009 were as follows:
2010 2009
In millions of dollars
Amortized
cost
Gross
unrealized
gains
Gross
unrealized
losses Fair value
Amortized
cost
Gross
unrealized
gains
Gross
unrealized
losses Fair value
Debt securities AFS
Mortgage-backed securities (1)
U.S. government-sponsored agency guaranteed $ 23,433 $ 425 $ 235 $ 23,623 $ 20,625 $ 339 $ 50 $ 20,914
Prime 1,985 18 177 1,826 7,291 119 932 6,478
Alt-A 46 2 — 48 538 93 4 627
Subprime 119 1 1 119 1 — — 1
Non-U.S. residential 315 1 — 316 258 — 3 255
Commercial 592 21 39 574 883 10 100 793
Total mortgage-backed securities $ 26,490 $ 468 $ 452 $ 26,506 $ 29,596 $ 561 $ 1,089 $ 29,068
U.S. Treasury and federal agency securities
U.S. Treasury 58,069 435 56 58,448 26,857 36 331 26,562
Agency obligations 43,294 375 55 43,614 27,714 46 208 27,552
Total U.S. Treasury and federal agency securities $101,363 $ 810 $ 111 $102,062 $ 54,571 $ 82 $ 539 $ 54,114
State and municipal 15,660 75 2,500 13,235 16,677 147 1,214 15,610
Foreign government 99,110 984 415 99,679 101,987 860 328 102,519
Corporate 15,910 319 59 16,170 20,024 435 146 20,313
Asset-backed securities (1) 9,085 31 68 9,048 10,089 50 93 10,046
Other debt securities 1,948 24 60 1,912 2,179 21 77 2,123
Total debt securities AFS $269,566 $ 2,711 $3,665 $268,612 $235,123 $ 2,156 $ 3,486 $233,793
Marketable equity securities AFS $ 3,791 $ 2,380 $ 211 $ 5,960 $ 4,089 $ 1,929 $ 212 $ 5,806
Total securities AFS $273,357 $5,091 $3,876 $274,572 $239,212 $ 4,085 $ 3,698 $239,599
(1) The Company invests in mortgage-backed and asset-backed securities. These securitizations are generally considered VIEs. The Company's maximum exposure to loss from these VIEs is equal to the carrying amount
of the securities, which is reflected in the table above. For mortgage-backed and asset-backed securitizations in which the Company has other involvement, information is provided in Note 22 to the Consolidated
Financial Statements.
At December 31, 2010, the cost of approximately 3,000 investments in
equity and fixed-income securities exceeded their fair value by $3.876 billion.
Of the $3.876 billion, the gross unrealized loss on equity securities was
$211 million. Of the remainder, $728 million represents fixed-income
investments that have been in a gross-unrealized-loss position for less than a
year and, of these, 99% are rated investment grade; $2.937 billion represents
fixed-income investments that have been in a gross-unrealized-loss position
for a year or more and, of these, 90% are rated investment grade.
The available-for-sale mortgage-backed securities-portfolio fair value
balance of $26.506 billion consists of $23.623 billion of government-
sponsored agency securities, and $2.883 billion of privately sponsored
securities of which the majority is backed by mortgages that are not Alt-A
or subprime.
The increase in gross unrealized losses on state and municipal debt
securities was the result of general tax-exempt municipal yields increasing
relatively faster than the yields on taxable fixed income instruments and the
effects of hedge accounting.
As discussed in more detail below, the Company conducts and documents
periodic reviews of all securities with unrealized losses to evaluate whether
the impairment is other than temporary. Any credit-related impairment
related to debt securities the Company does not plan to sell and is not
likely to be required to sell is recognized in the Consolidated Statement of
Income, with the non-credit-related impairment recognized in OCI. For
other impaired debt securities, the entire impairment is recognized in the
Consolidated Statement of Income.