Citibank 2010 Annual Report Download - page 106
Download and view the complete annual report
Please find page 106 of the 2010 Citibank annual report below. You can navigate through the pages in the report by either clicking on the pages listed below, or by using the keyword search tool below to find specific information within the annual report.-
 1
1 -
2
-
3
-
4
-
5
-
6
-
7
-
8
-
9
-
10
-
11
-
12
-
13
-
14
-
15
-
16
-
17
-
18
-
19
-
20
-
21
-
22
-
23
-
24
-
25
-
26
-
27
-
28
-
29
-
30
-
31
-
32
-
33
-
34
-
35
-
36
-
37
-
38
-
39
-
40
-
41
-
42
-
43
-
44
-
45
-
46
-
47
-
48
-
49
-
50
-
51
-
52
-
53
-
54
-
55
-
56
-
57
-
58
-
59
-
60
-
61
-
62
-
63
-
64
-
65
-
66
-
67
-
68
-
69
-
70
-
71
-
72
-
73
-
74
-
75
-
76
-
77
-
78
-
79
-
80
-
81
-
82
-
83
-
84
-
85
-
86
-
87
-
88
-
89
-
90
-
91
-
92
-
93
-
94
-
95
-
 96
96 -
 97
97 -
 98
98 -
 99
99 -
 100
100 -
 101
101 -
 102
102 -
 103
103 -
 104
104 -
 105
105 -
 106
106 -
 107
107 -
 108
108 -
 109
109 -
 110
110 -
 111
111 -
 112
112 -
 113
113 -
 114
114 -
 115
115 -
 116
116 -
117
-
118
-
119
-
120
-
121
-
122
-
123
-
124
-
125
-
126
-
127
-
128
-
129
-
130
-
131
-
132
-
133
-
134
-
135
-
136
-
137
-
138
-
139
-
140
-
141
-
142
-
143
-
144
-
145
-
146
-
147
-
148
-
149
-
150
-
151
-
152
-
153
-
154
-
155
-
156
-
157
-
158
-
159
-
160
-
161
-
162
-
163
-
164
-
165
-
166
-
167
-
168
-
169
-
170
-
171
-
172
-
173
-
174
-
175
-
176
-
177
-
178
-
179
-
180
-
181
-
182
-
183
-
184
-
185
-
186
-
187
-
188
-
189
-
190
-
191
-
192
-
193
-
194
-
195
-
196
-
197
-
198
-
199
-
200
-
201
-
202
-
203
-
204
-
205
-
206
-
207
-
208
-
209
-
210
-
211
-
212
-
213
-
214
-
215
-
216
-
217
-
218
-
219
-
220
-
221
-
222
-
223
-
224
-
225
-
226
-
227
-
228
-
229
-
230
-
231
-
232
-
233
-
234
-
235
-
236
-
237
-
238
-
239
-
240
-
241
-
242
-
243
-
244
-
245
-
246
-
247
-
248
-
249
-
250
-
251
-
252
-
253
-
254
-
255
-
256
-
257
-
258
-
259
-
260
-
261
-
262
-
263
-
264
-
265
-
266
-
267
-
268
-
269
-
270
-
271
-
272
-
273
-
274
-
275
-
276
-
277
-
278
-
279
-
280
-
281
-
282
-
283
-
284
-
285
-
286
-
287
-
288
-
289
-
290
-
291
-
292
-
293
-
294
-
295
-
296
-
297
-
298
-
299
-
300
-
301
-
302
-
303
-
304
-
305
-
306
-
307
-
308
-
309
-
310
-
311
-
312
 |
 |

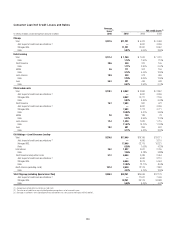
104
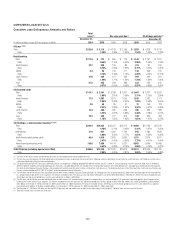
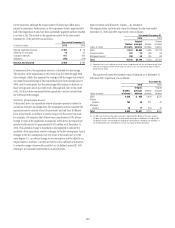
Consumer Loan Net Credit Losses and Ratios
Average
loans (1) Net credit losses (2)
In millions of dollars, except average loan amounts in billions 2010 2010 2009 2008
Citicorp
Total $221.5 $11,221 $ 5,410 $ 4,068
Add: impact of credit card securitizations (3) —6,931 4,299
Managed NCL 11,221 12,341 8,367
Ratio 5.07% 5.64% 3.66%
Retail banking
Total $111.4 $ 1,269 $ 1,570 $ 1,201
Ratio 1.14% 1.50% 1.10%
North America 30.6 339 310 145
Ratio 1.11% 0.90% 0.47%
EMEA 4.6 171 302 159
Ratio 3.74% 5.44% 2.36%
Latin America 19.9 438 513 489
Ratio 2.20% 3.09% 2.90%
Asia 56.3 321 445 408
Ratio 0.57% 0.92% 0.74%
Citi-branded cards
Total $110.1 $ 9,952 $ 3,840 $ 2,867
Add: impact of credit card securitizations (3) —6,931 4,299
Managed NCL 9,952 10,771 7,166
Ratio 9.03% 9.46% 6.03%
North America 76.7 7,683 841 472
Add: impact of credit card securitizations (3) —6,931 4,299
Managed NCL 7,683 7,772 4,771
Ratio 10.02% 9.41% 5.65%
EMEA 2.8 149 185 78
Ratio 5.32% 6.55% 2.76%
Latin America 12.4 1,429 1,920 1,715
Ratio 11.57% 16.10% 11.93%
Asia 18.2 691 894 602
Ratio 3.77% 5.42% 3.52%
Citi Holdings—Local Consumer Lending
Total $274.8 $17,040 $19,185 $13,111
Add: impact of credit card securitizations (3) —4,590 3,110
Managed NCL 17,040 23,775 16,221
Ratio 6.20% 7.03% 4.23%
International 26.2 1,927 3,521 2,795
Ratio 7.36% 9.18% 5.88%
North America retail partner cards 51.2 6,564 3,485 2,454
Add: impact of credit card securitizations (3) —4,590 3,110
Managed NCL 6,564 8,075 5,564
Ratio 12.82% 12.77% 8.04%
North America (excluding cards) 197.4 8,549 12,179 7,862
Ratio 4.33% 5.15% 2.95%
Total Citigroup (excluding Special Asset Pool) $496.3 $28,261 $24,595 $17,179
Add: impact of credit card securitizations (3) —11,521 7,409
Managed NCL 28,261 36,116 24,588
Ratio 5.69% 6.49% 4.02%
(1) Average loans include interest and fees on credit cards.
(2) The ratios of net credit losses are calculated based on average loans, net of unearned income.
(3) See page 24 and Note 1 to the Consolidated Financial Statements for a discussion of the impact of SFAS 166/167.