Citibank 2010 Annual Report Download - page 271
Download and view the complete annual report
Please find page 271 of the 2010 Citibank annual report below. You can navigate through the pages in the report by either clicking on the pages listed below, or by using the keyword search tool below to find specific information within the annual report.-
 1
1 -
2
-
3
-
4
-
5
-
6
-
7
-
8
-
9
-
10
-
11
-
12
-
13
-
14
-
15
-
16
-
17
-
18
-
19
-
20
-
21
-
22
-
23
-
24
-
25
-
26
-
27
-
28
-
29
-
30
-
31
-
32
-
33
-
34
-
35
-
36
-
37
-
38
-
39
-
40
-
41
-
42
-
43
-
44
-
45
-
46
-
47
-
48
-
49
-
50
-
51
-
52
-
53
-
54
-
55
-
56
-
57
-
58
-
59
-
60
-
61
-
62
-
63
-
64
-
65
-
66
-
67
-
68
-
69
-
70
-
71
-
72
-
73
-
74
-
75
-
76
-
77
-
78
-
79
-
80
-
81
-
82
-
83
-
84
-
85
-
86
-
87
-
88
-
89
-
90
-
91
-
92
-
93
-
94
-
95
-
96
-
97
-
98
-
99
-
100
-
101
-
102
-
103
-
104
-
105
-
106
-
107
-
108
-
109
-
110
-
111
-
112
-
113
-
114
-
115
-
116
-
117
-
118
-
119
-
120
-
121
-
122
-
123
-
124
-
125
-
126
-
127
-
128
-
129
-
130
-
131
-
132
-
133
-
134
-
135
-
136
-
137
-
138
-
139
-
140
-
141
-
142
-
143
-
144
-
145
-
146
-
147
-
148
-
149
-
150
-
151
-
152
-
153
-
154
-
155
-
156
-
157
-
158
-
159
-
160
-
161
-
162
-
163
-
164
-
165
-
166
-
167
-
168
-
169
-
170
-
171
-
172
-
173
-
174
-
175
-
176
-
177
-
178
-
179
-
180
-
181
-
182
-
183
-
184
-
185
-
186
-
187
-
188
-
189
-
190
-
191
-
192
-
193
-
194
-
195
-
196
-
197
-
198
-
199
-
200
-
201
-
202
-
203
-
204
-
205
-
206
-
207
-
208
-
209
-
210
-
211
-
212
-
213
-
214
-
215
-
216
-
217
-
218
-
219
-
220
-
221
-
222
-
223
-
224
-
225
-
226
-
227
-
228
-
229
-
230
-
231
-
232
-
233
-
234
-
235
-
236
-
237
-
238
-
239
-
240
-
241
-
242
-
243
-
244
-
245
-
246
-
247
-
248
-
249
-
250
-
251
-
252
-
253
-
254
-
255
-
256
-
257
-
258
-
259
-
260
-
 261
261 -
 262
262 -
 263
263 -
 264
264 -
 265
265 -
 266
266 -
 267
267 -
 268
268 -
 269
269 -
 270
270 -
 271
271 -
 272
272 -
 273
273 -
 274
274 -
 275
275 -
 276
276 -
 277
277 -
 278
278 -
 279
279 -
 280
280 -
 281
281 -
282
-
283
-
284
-
285
-
286
-
287
-
288
-
289
-
290
-
291
-
292
-
293
-
294
-
295
-
296
-
297
-
298
-
299
-
300
-
301
-
302
-
303
-
304
-
305
-
306
-
307
-
308
-
309
-
310
-
311
-
312
 |
 |

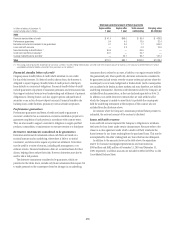
269
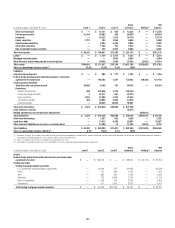
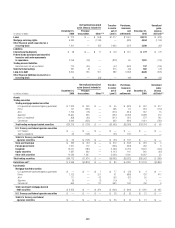
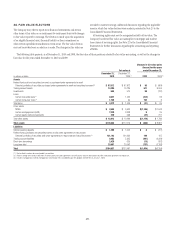
Net realized/unrealized
gains (losses) included in Transfers
in and/or
out of
Level 3
Purchases,
issuances
and
settlements
December 31,
2009
Unrealized
gains
(losses)
still held (3)
In millions of dollars
December 31,
2008
Principal
transactions Other (1)(2)
State and municipal $ 222 $ — $ 2 $ (13) $ 6 $ 217 $ —
Foreign government 571 — (6) (302) 7 270 (3)
Corporate 1,019 — 13 762 (537) 1,257 16
Equity securities 3,807 — (453) (146) (695) 2,513 41
Other debt securities 11,324 — 279 (1,292) (1,479) 8,832 (81)
Non-marketable equity securities 9,067 — (538) (137) (1,639) 6,753 69
Total investments $28,273 $ — $ (379) $(1,505) $(4,986) $21,403 $ 467
Loans $ 160 $ — $ 51 $ 7 $ (5) $ 213 $ 9
Mortgage servicing rights 5,657 — 1,543 — (670) 6,530 1,582
Other financial assets measured on a
recurring basis 359 — 305 761 (324) 1,101 215
Liabilities
Interest-bearing deposits $ 54 $ — $ 2 $ (6) $ (18) $ 28 $ (14)
Federal funds purchased and securities
loaned or sold under agreements
to repurchase 11,167 359 — (8,601) (151) 2,056 250
Trading account liabilities
Securities sold, not yet purchased 653 (11) — (180) 290 774 (52)
Short-term borrowings 1,329 (48) — (775) (371) 231 (76)
Long-term debt 11,198 (290) — (504) (1,330) 9,654 124
Other financial liabilities measured on a
recurring basis 1 — (75) — (63) 13 —
(1) Changes in fair value for available-for-sale investments (debt securities) are recorded in Accumulated other comprehensive income (loss) on the Consolidated Balance Sheet, while gains and losses from sales are
recorded in Realized gains (losses) from sales of investments on the Consolidated Statement of Income.
(2) Unrealized gains (losses) on MSRs are recorded in Commissions and fees on the Consolidated Statement of Income.
(3) Represents the amount of total gains or losses for the period, included in earnings (and Accumulated other comprehensive income (loss) for changes in fair value for available-for-sale investments), attributable to the
change in fair value relating to assets and liabilities classified as Level 3 that are still held at December 31, 2010 and 2009.
(4) Total Level 3 derivative exposures have been netted in these tables for presentation purposes only.
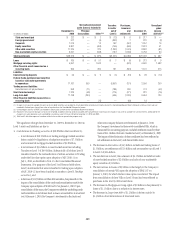
The significant changes from December 31, 2009 to December 31, 2010 in
Level 3 assets and liabilities are due to:
A net decrease in • Trading securities of $20.8 billion that was driven by:
A net decrease of $10.2 billion in trading mortgage-backed securities –
driven mainly by liquidations of subprime securities of $7.5 billion
and commercial mortgage-backed securities of $1.8 billion;
A net increase of $3.6 billion in asset-backed securities including –
Transfers to Level 3 of $4.9 billion. Substantially all of these Level 3
transfers related to the reclassification of certain securities to Trading
under the fair value option upon adoption of ASU 2010-11 on
July 1, 2010, as described in Note 1 to the Consolidated Financial
Statements. (For purposes of the Level 3 roll-forward table above,
Level 3 investments that were reclassified to trading upon adoption
of ASU 2010-11 have been classified as transfers to Level 3 Trading
securities); and
A decrease of $11.9 billion in Other debt securities, due primarily to the –
impact of the consolidation of the credit card securitization trusts by the
Company upon adoption of SFAS 166/167 on January 1, 2010. Upon
consolidation of the trusts, the Company recorded the underlying credit
card receivables on its balance sheet as Loans accounted for at amortized
cost. At January 1, 2010, the Company’s investments in the trusts and
other inter-company balances are eliminated. At January 1, 2010,
the Company’s investment in these newly consolidated VIEs, which is
eliminated for accounting purposes, included certificates issued by these
trusts of $11.1 billion that were classified as Level 3 at December 31, 2009.
The impact of the elimination of these certificates has been reflected as
net settlements in the Level 3 roll-forward table above.
The decrease in • Derivatives of $4.5 billion includes net trading losses of
$1.5 billion, net settlements of $2.4 billion and net transfers out of Level 3
to Level 2 of $0.6 billion.
The net decrease in Level 3 • Investments of $4.1 billion included net sales
of asset-backed securities of $2.6 billion and sales of non-marketable
equity securities of $1 billion.
The net increase in • Loans of $3 billion is due largely to the Company’s
consolidation of certain VIEs upon the adoption of SFAS 167 on
January 1, 2010, for which the fair value option was elected. The impact
from consolidation of these VIEs on Level 3 loans has been reflected as
purchases in the Level 3 roll-forward above.
The decrease in • Mortgage servicing rights of $2 billion is due primarily to
losses of $1.1 billion, due to a reduction in interest rates.
The decrease in • Long-term debt of $1.2 billion is driven mainly by
$1.3 billion of net terminations of structured notes.