Citibank 2010 Annual Report Download - page 222
Download and view the complete annual report
Please find page 222 of the 2010 Citibank annual report below. You can navigate through the pages in the report by either clicking on the pages listed below, or by using the keyword search tool below to find specific information within the annual report.-
 1
1 -
2
-
3
-
4
-
5
-
6
-
7
-
8
-
9
-
10
-
11
-
12
-
13
-
14
-
15
-
16
-
17
-
18
-
19
-
20
-
21
-
22
-
23
-
24
-
25
-
26
-
27
-
28
-
29
-
30
-
31
-
32
-
33
-
34
-
35
-
36
-
37
-
38
-
39
-
40
-
41
-
42
-
43
-
44
-
45
-
46
-
47
-
48
-
49
-
50
-
51
-
52
-
53
-
54
-
55
-
56
-
57
-
58
-
59
-
60
-
61
-
62
-
63
-
64
-
65
-
66
-
67
-
68
-
69
-
70
-
71
-
72
-
73
-
74
-
75
-
76
-
77
-
78
-
79
-
80
-
81
-
82
-
83
-
84
-
85
-
86
-
87
-
88
-
89
-
90
-
91
-
92
-
93
-
94
-
95
-
96
-
97
-
98
-
99
-
100
-
101
-
102
-
103
-
104
-
105
-
106
-
107
-
108
-
109
-
110
-
111
-
112
-
113
-
114
-
115
-
116
-
117
-
118
-
119
-
120
-
121
-
122
-
123
-
124
-
125
-
126
-
127
-
128
-
129
-
130
-
131
-
132
-
133
-
134
-
135
-
136
-
137
-
138
-
139
-
140
-
141
-
142
-
143
-
144
-
145
-
146
-
147
-
148
-
149
-
150
-
151
-
152
-
153
-
154
-
155
-
156
-
157
-
158
-
159
-
160
-
161
-
162
-
163
-
164
-
165
-
166
-
167
-
168
-
169
-
170
-
171
-
172
-
173
-
174
-
175
-
176
-
177
-
178
-
179
-
180
-
181
-
182
-
183
-
184
-
185
-
186
-
187
-
188
-
189
-
190
-
191
-
192
-
193
-
194
-
195
-
196
-
197
-
198
-
199
-
200
-
201
-
202
-
203
-
204
-
205
-
206
-
207
-
208
-
209
-
210
-
211
-
 212
212 -
 213
213 -
 214
214 -
 215
215 -
 216
216 -
 217
217 -
 218
218 -
 219
219 -
 220
220 -
 221
221 -
 222
222 -
 223
223 -
 224
224 -
 225
225 -
 226
226 -
 227
227 -
 228
228 -
 229
229 -
 230
230 -
 231
231 -
 232
232 -
233
-
234
-
235
-
236
-
237
-
238
-
239
-
240
-
241
-
242
-
243
-
244
-
245
-
246
-
247
-
248
-
249
-
250
-
251
-
252
-
253
-
254
-
255
-
256
-
257
-
258
-
259
-
260
-
261
-
262
-
263
-
264
-
265
-
266
-
267
-
268
-
269
-
270
-
271
-
272
-
273
-
274
-
275
-
276
-
277
-
278
-
279
-
280
-
281
-
282
-
283
-
284
-
285
-
286
-
287
-
288
-
289
-
290
-
291
-
292
-
293
-
294
-
295
-
296
-
297
-
298
-
299
-
300
-
301
-
302
-
303
-
304
-
305
-
306
-
307
-
308
-
309
-
310
-
311
-
312
 |
 |

220
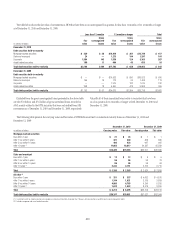
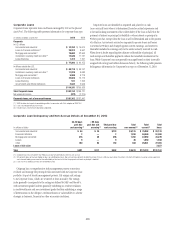
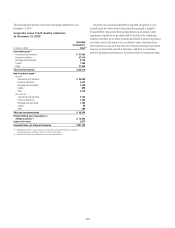
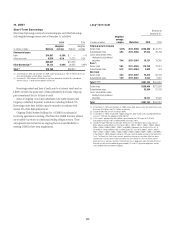
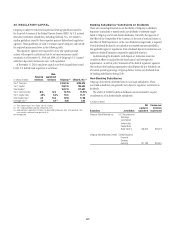
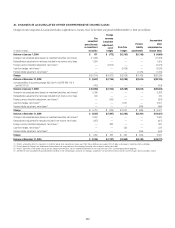
The following table presents non-accrual loan information by Corporate loan type at and for the period ended December 31, 2010 and 2009, respectively:
Non-Accrual Corporate Loans
At and for the period ended Dec. 31, 2010 Dec. 31, 2009
In millions of dollars
Recorded
investment (1)
Principal
balance
Related
specific
allowance
Average
carrying
value (2)
Interest
income
recognized
Recorded
investment (1)
Non-accrual Corporate loans
Commercial and industrial $5,125 $ 8,021 $ 843 $ 6,016 $28 $ 6,347
Loans to financial institutions 1,258 1,835 259 883 1 1,794
Mortgage and real estate 1,782 2,328 369 2,474 7 4,051
Lease financing 45 71 — 55 4 —
Other 400 948 218 1,205 25 1,287
Total non-accrual Corporate loans $ 8,610 $ 13,203 $1,689 $10,633 $65 $13,479
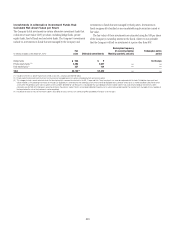
At and for the period ended
In millions of dollars
Dec. 31,
2009
Dec. 31,
2008
Average carrying value (2) $12,990 $4,157
Interest income recognized 21 49
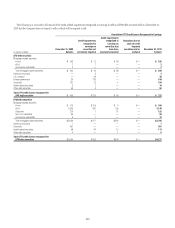
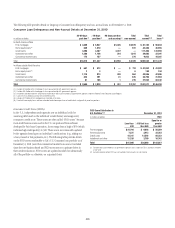
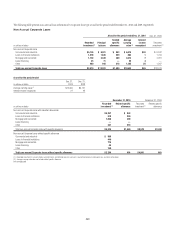
December 31, 2010 December 31, 2009
In millions of dollars
Recorded
investment (1)
Related specific
allowance
Recorded
investment (1)
Related specific
allowance
Non-accrual Corporate loans with valuation allowances
Commercial and industrial $4,257 $ 843
Loans to financial institutions 818 259
Mortgage and real estate 1,008 369
Lease financing — —
Other 241 218
Total non-accrual Corporate loans with specific allowance $6,324 $1,689 $ 8,578 $ 2,480
Non-accrual Corporate loans without specific allowance
Commercial and industrial $ 868
Loans to financial institutions 440
Mortgage and real estate 774
Lease financing 45
Other 159
Total non-accrual Corporate loans without specific allowance $ 2,286 N/A $4,901 N/A
(1) Recorded investment in a loan includes accrued interest, net deferred loan fees and costs, unamortized premium or discount, less any direct write-downs.
(2) Average carrying value does not include related specific allowance.
N/A Not Applicable