Citibank 2010 Annual Report Download - page 159
Download and view the complete annual report
Please find page 159 of the 2010 Citibank annual report below. You can navigate through the pages in the report by either clicking on the pages listed below, or by using the keyword search tool below to find specific information within the annual report.-
 1
1 -
2
-
3
-
4
-
5
-
6
-
7
-
8
-
9
-
10
-
11
-
12
-
13
-
14
-
15
-
16
-
17
-
18
-
19
-
20
-
21
-
22
-
23
-
24
-
25
-
26
-
27
-
28
-
29
-
30
-
31
-
32
-
33
-
34
-
35
-
36
-
37
-
38
-
39
-
40
-
41
-
42
-
43
-
44
-
45
-
46
-
47
-
48
-
49
-
50
-
51
-
52
-
53
-
54
-
55
-
56
-
57
-
58
-
59
-
60
-
61
-
62
-
63
-
64
-
65
-
66
-
67
-
68
-
69
-
70
-
71
-
72
-
73
-
74
-
75
-
76
-
77
-
78
-
79
-
80
-
81
-
82
-
83
-
84
-
85
-
86
-
87
-
88
-
89
-
90
-
91
-
92
-
93
-
94
-
95
-
96
-
97
-
98
-
99
-
100
-
101
-
102
-
103
-
104
-
105
-
106
-
107
-
108
-
109
-
110
-
111
-
112
-
113
-
114
-
115
-
116
-
117
-
118
-
119
-
120
-
121
-
122
-
123
-
124
-
125
-
126
-
127
-
128
-
129
-
130
-
131
-
132
-
133
-
134
-
135
-
136
-
137
-
138
-
139
-
140
-
141
-
142
-
143
-
144
-
145
-
146
-
147
-
148
-
 149
149 -
 150
150 -
 151
151 -
 152
152 -
 153
153 -
 154
154 -
 155
155 -
 156
156 -
 157
157 -
 158
158 -
 159
159 -
 160
160 -
 161
161 -
 162
162 -
 163
163 -
 164
164 -
 165
165 -
 166
166 -
 167
167 -
 168
168 -
 169
169 -
170
-
171
-
172
-
173
-
174
-
175
-
176
-
177
-
178
-
179
-
180
-
181
-
182
-
183
-
184
-
185
-
186
-
187
-
188
-
189
-
190
-
191
-
192
-
193
-
194
-
195
-
196
-
197
-
198
-
199
-
200
-
201
-
202
-
203
-
204
-
205
-
206
-
207
-
208
-
209
-
210
-
211
-
212
-
213
-
214
-
215
-
216
-
217
-
218
-
219
-
220
-
221
-
222
-
223
-
224
-
225
-
226
-
227
-
228
-
229
-
230
-
231
-
232
-
233
-
234
-
235
-
236
-
237
-
238
-
239
-
240
-
241
-
242
-
243
-
244
-
245
-
246
-
247
-
248
-
249
-
250
-
251
-
252
-
253
-
254
-
255
-
256
-
257
-
258
-
259
-
260
-
261
-
262
-
263
-
264
-
265
-
266
-
267
-
268
-
269
-
270
-
271
-
272
-
273
-
274
-
275
-
276
-
277
-
278
-
279
-
280
-
281
-
282
-
283
-
284
-
285
-
286
-
287
-
288
-
289
-
290
-
291
-
292
-
293
-
294
-
295
-
296
-
297
-
298
-
299
-
300
-
301
-
302
-
303
-
304
-
305
-
306
-
307
-
308
-
309
-
310
-
311
-
312
 |
 |

157
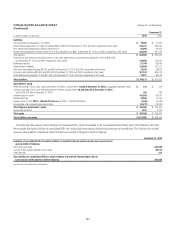
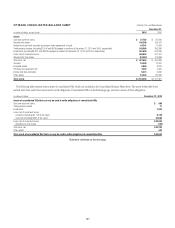
CITIBANK CONSOLIDATED BALANCE SHEET Citibank, N.A. and Subsidiaries
December 31,
In millions of dollars, except shares 2010 2009
Assets
Cash and due from banks $ 21,702 $ 20,246
Deposits with banks 146,208 154,372
Federal funds sold and securities purchased under agreements to resell 43,341 31,434
Trading account assets (including $1,006 and $914 pledged to creditors at December 31, 2010 and 2009, respectively) 149,560 156,380
Investments (including $5,221 and $3,849 pledged to creditors at December 31, 2010 and 2009, respectively) 252,559 233,086
Loans, net of unearned income 446,052 477,974
Allowance for loan losses (18,467) (22,685)
Total loans, net $ 427,585 $ 455,289
Goodwill 10,420 10,200
Intangible assets 5,850 8,243
Premises and equipment, net 4,392 4,832
Interest and fees receivable 5,273 6,840
Other assets 87,403 80,439
Total assets $1,154,293 $1,161,361
The following table presents certain assets of consolidated VIEs, which are included in the Consolidated Balance Sheet above. The assets in the table below
include only those assets that can be used to settle obligations of consolidated VIEs on the following page, and are in excess of those obligations.
In millions of dollars December 31, 2010
Assets of consolidated VIEs that can only be used to settle obligations of consolidated VIEs
Cash and due from banks $ 586
Trading account assets 71
Investments 7,832
Loans, net of unearned income
Consumer (including $1,718 at fair value) 8,138
Corporate (including $290 at fair value) 22,666
Loans, net of unearned income $ 30,804
Allowance for loan losses (102)
Total loans, net $ 30,702
Other assets 342
Total assets of consolidated VIEs that can only be used to settle obligations of consolidated VIEs $ 39,533
Statement continues on the next page