Citibank 2010 Annual Report Download - page 296
Download and view the complete annual report
Please find page 296 of the 2010 Citibank annual report below. You can navigate through the pages in the report by either clicking on the pages listed below, or by using the keyword search tool below to find specific information within the annual report.-
 1
1 -
2
-
3
-
4
-
5
-
6
-
7
-
8
-
9
-
10
-
11
-
12
-
13
-
14
-
15
-
16
-
17
-
18
-
19
-
20
-
21
-
22
-
23
-
24
-
25
-
26
-
27
-
28
-
29
-
30
-
31
-
32
-
33
-
34
-
35
-
36
-
37
-
38
-
39
-
40
-
41
-
42
-
43
-
44
-
45
-
46
-
47
-
48
-
49
-
50
-
51
-
52
-
53
-
54
-
55
-
56
-
57
-
58
-
59
-
60
-
61
-
62
-
63
-
64
-
65
-
66
-
67
-
68
-
69
-
70
-
71
-
72
-
73
-
74
-
75
-
76
-
77
-
78
-
79
-
80
-
81
-
82
-
83
-
84
-
85
-
86
-
87
-
88
-
89
-
90
-
91
-
92
-
93
-
94
-
95
-
96
-
97
-
98
-
99
-
100
-
101
-
102
-
103
-
104
-
105
-
106
-
107
-
108
-
109
-
110
-
111
-
112
-
113
-
114
-
115
-
116
-
117
-
118
-
119
-
120
-
121
-
122
-
123
-
124
-
125
-
126
-
127
-
128
-
129
-
130
-
131
-
132
-
133
-
134
-
135
-
136
-
137
-
138
-
139
-
140
-
141
-
142
-
143
-
144
-
145
-
146
-
147
-
148
-
149
-
150
-
151
-
152
-
153
-
154
-
155
-
156
-
157
-
158
-
159
-
160
-
161
-
162
-
163
-
164
-
165
-
166
-
167
-
168
-
169
-
170
-
171
-
172
-
173
-
174
-
175
-
176
-
177
-
178
-
179
-
180
-
181
-
182
-
183
-
184
-
185
-
186
-
187
-
188
-
189
-
190
-
191
-
192
-
193
-
194
-
195
-
196
-
197
-
198
-
199
-
200
-
201
-
202
-
203
-
204
-
205
-
206
-
207
-
208
-
209
-
210
-
211
-
212
-
213
-
214
-
215
-
216
-
217
-
218
-
219
-
220
-
221
-
222
-
223
-
224
-
225
-
226
-
227
-
228
-
229
-
230
-
231
-
232
-
233
-
234
-
235
-
236
-
237
-
238
-
239
-
240
-
241
-
242
-
243
-
244
-
245
-
246
-
247
-
248
-
249
-
250
-
251
-
252
-
253
-
254
-
255
-
256
-
257
-
258
-
259
-
260
-
261
-
262
-
263
-
264
-
265
-
266
-
267
-
268
-
269
-
270
-
271
-
272
-
273
-
274
-
275
-
276
-
277
-
278
-
279
-
280
-
281
-
282
-
283
-
284
-
285
-
 286
286 -
 287
287 -
 288
288 -
 289
289 -
 290
290 -
 291
291 -
 292
292 -
 293
293 -
 294
294 -
 295
295 -
 296
296 -
 297
297 -
 298
298 -
 299
299 -
 300
300 -
 301
301 -
 302
302 -
 303
303 -
 304
304 -
 305
305 -
 306
306 -
307
-
308
-
309
-
310
-
311
-
312
 |
 |

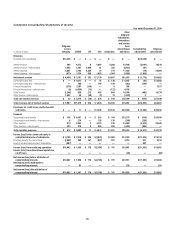
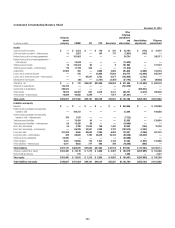
294
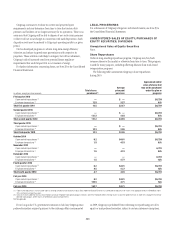
Condensed Consolidating Balance Sheet
December 31, 2010
In millions of dollars
Citigroup
parent
company CGMHI CFI CCC Associates
Other
Citigroup
subsidiaries
and
eliminations
Consolidating
adjustments
Citigroup
consolidated
Assets
Cash and due from banks $ — $ 2,553 $ — $ 170 $ 221 $ 25,198 $ (170) $ 27,972
Cash and due from banks—intercompany 11 2,667 — 153 177 (2,855) (153) —
Federal funds sold and resale agreements — 191,963 — — — 54,754 — 246,717
Federal funds sold and resale agreements—
intercompany — 14,530 — — — (14,530) — —
Trading account assets 15 135,224 60 — 9 181,964 — 317,272
Trading account assets—intercompany 55 11,195 426 — — (11,676) — —
Investments 21,982 263 — 2,008 2,093 293,826 (2,008) 318,164
Loans, net of unearned income — 216 — 32,948 37,803 610,775 (32,948) 648,794
Loans, net of unearned income—intercompany — — 95,507 3,723 6,517 (102,024) (3,723) —
Allowance for loan losses — (46) — (3,181) (3,467) (37,142) 3,181 (40,655)
Total loans, net $ — $ 170 $95,507 $33,490 $40,853 $ 471,609 $ (33,490) $ 608,139
Advances to subsidiaries 133,320 — — — — (133,320) — —
Investments in subsidiaries 205,043 — — — — — (205,043) —
Other assets 19,572 66,467 561 4,318 8,311 300,727 (4,318) 395,638
Other assets—intercompany 10,609 46,856 2,549 — 1,917 (61,931) — —
Total assets $390,607 $471,888 $99,103 $40,139 $53,581 $1,103,766 $(245,182) $1,913,902
Liabilities and equity
Deposits $ — $ — $ — $ — $ — $ 844,968 $ — $ 844,968
Federal funds purchased and securities
loaned or sold — 156,312 — — — 33,246 — 189,558
Federal funds purchased and securities
loaned or sold—intercompany 185 7,537 — — — (7,722) — —
Trading account liabilities — 75,454 45 — — 53,555 — 129,054
Trading account liabilities—intercompany 55 10,265 88 — — (10,408) — —
Short-term borrowings 16 2,296 11,024 750 1,491 63,963 (750) 78,790
Short-term borrowings—intercompany — 66,838 33,941 4,208 2,797 (103,576) (4,208) —
Long-term debt 191,944 9,566 50,629 3,396 6,603 122,441 (3,396) 381,183
Long-term debt—intercompany 389 60,088 1,705 26,339 33,224 (95,406) (26,339) —
Advances from subsidiaries 22,698 — — — — (22,698) — —
Other liabilities 5,841 58,056 175 1,922 3,104 57,384 (1,922) 124,560
Other liabilities—intercompany 6,011 9,883 277 668 295 (16,466) (668) —
Total liabilities $227,139 $456,295 $97,884 $37,283 $47,514 $ 919,281 $ (37,283) $1,748,113
Citigroup stockholders’ equity $163,468 $ 15,178 $ 1,219 $ 2,856 $ 6,067 $ 182,579 $(207,899) $ 163,468
Noncontrolling interests — 415 — — — 1,906 — 2,321
Total equity $163,468 $ 15,593 $ 1,219 $ 2,856 $ 6,067 $ 184,485 $(207,899) $ 165,789
Total liabilities and equity $390,607 $471,888 $99,103 $40,139 $53,581 $1,103,766 $(245,182) $1,913,902