Citibank 2010 Annual Report Download - page 245
Download and view the complete annual report
Please find page 245 of the 2010 Citibank annual report below. You can navigate through the pages in the report by either clicking on the pages listed below, or by using the keyword search tool below to find specific information within the annual report.-
 1
1 -
2
-
3
-
4
-
5
-
6
-
7
-
8
-
9
-
10
-
11
-
12
-
13
-
14
-
15
-
16
-
17
-
18
-
19
-
20
-
21
-
22
-
23
-
24
-
25
-
26
-
27
-
28
-
29
-
30
-
31
-
32
-
33
-
34
-
35
-
36
-
37
-
38
-
39
-
40
-
41
-
42
-
43
-
44
-
45
-
46
-
47
-
48
-
49
-
50
-
51
-
52
-
53
-
54
-
55
-
56
-
57
-
58
-
59
-
60
-
61
-
62
-
63
-
64
-
65
-
66
-
67
-
68
-
69
-
70
-
71
-
72
-
73
-
74
-
75
-
76
-
77
-
78
-
79
-
80
-
81
-
82
-
83
-
84
-
85
-
86
-
87
-
88
-
89
-
90
-
91
-
92
-
93
-
94
-
95
-
96
-
97
-
98
-
99
-
100
-
101
-
102
-
103
-
104
-
105
-
106
-
107
-
108
-
109
-
110
-
111
-
112
-
113
-
114
-
115
-
116
-
117
-
118
-
119
-
120
-
121
-
122
-
123
-
124
-
125
-
126
-
127
-
128
-
129
-
130
-
131
-
132
-
133
-
134
-
135
-
136
-
137
-
138
-
139
-
140
-
141
-
142
-
143
-
144
-
145
-
146
-
147
-
148
-
149
-
150
-
151
-
152
-
153
-
154
-
155
-
156
-
157
-
158
-
159
-
160
-
161
-
162
-
163
-
164
-
165
-
166
-
167
-
168
-
169
-
170
-
171
-
172
-
173
-
174
-
175
-
176
-
177
-
178
-
179
-
180
-
181
-
182
-
183
-
184
-
185
-
186
-
187
-
188
-
189
-
190
-
191
-
192
-
193
-
194
-
195
-
196
-
197
-
198
-
199
-
200
-
201
-
202
-
203
-
204
-
205
-
206
-
207
-
208
-
209
-
210
-
211
-
212
-
213
-
214
-
215
-
216
-
217
-
218
-
219
-
220
-
221
-
222
-
223
-
224
-
225
-
226
-
227
-
228
-
229
-
230
-
231
-
232
-
233
-
234
-
 235
235 -
 236
236 -
 237
237 -
 238
238 -
 239
239 -
 240
240 -
 241
241 -
 242
242 -
 243
243 -
 244
244 -
 245
245 -
 246
246 -
 247
247 -
 248
248 -
 249
249 -
 250
250 -
 251
251 -
 252
252 -
 253
253 -
 254
254 -
 255
255 -
256
-
257
-
258
-
259
-
260
-
261
-
262
-
263
-
264
-
265
-
266
-
267
-
268
-
269
-
270
-
271
-
272
-
273
-
274
-
275
-
276
-
277
-
278
-
279
-
280
-
281
-
282
-
283
-
284
-
285
-
286
-
287
-
288
-
289
-
290
-
291
-
292
-
293
-
294
-
295
-
296
-
297
-
298
-
299
-
300
-
301
-
302
-
303
-
304
-
305
-
306
-
307
-
308
-
309
-
310
-
311
-
312
 |
 |

243
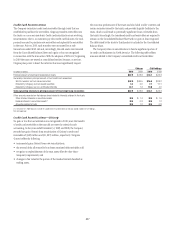
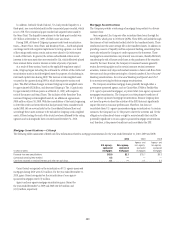
Mortgage Servicing Rights
In connection with the securitization of mortgage loans, the Company’s
U.S. Consumer mortgage business retains the servicing rights, which entitle
the Company to a future stream of cash flows based on the outstanding
principal balances of the loans and the contractual servicing fee. Failure to
service the loans in accordance with contractual requirements may lead to a
termination of the servicing rights and the loss of future servicing fees.
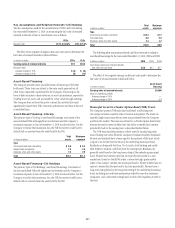
The fair value of capitalized mortgage servicing rights (MSRs) was
$4.6 billion and $6.5 billion at December 31, 2010 and 2009, respectively.
The MSRs correspond to principal loan balances of $455 billion and
$555 billion as of December 31, 2010 and 2009, respectively. The following
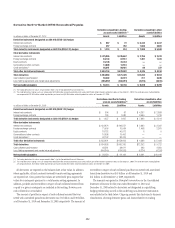
table summarizes the changes in capitalized MSRs for the years ended
December 31, 2010 and 2009:
In millions of dollars 2010 2009
Balance, beginning of year $ 6,530 $ 5,657
Originations 658 1,035
Changes in fair value of MSRs due to changes
in inputs and assumptions (1,067) 1,546
Other changes (1) (1,567) (1,708)
Balance, end of year $ 4,554 $ 6,530
(1) Represents changes due to customer payments and passage of time.
The market for MSRs is not sufficiently liquid to provide participants
with quoted market prices. Therefore, the Company uses an option-adjusted
spread valuation approach to determine the fair value of MSRs. This
approach consists of projecting servicing cash flows under multiple interest
rate scenarios and discounting these cash flows using risk-adjusted discount
rates. The key assumptions used in the valuation of MSRs include mortgage
prepayment speeds and discount rates. The model assumptions and the
MSRs’ fair value estimates are compared to observable trades of similar MSR
portfolios and interest-only security portfolios, as available, as well as to MSR
broker valuations and industry surveys. The cash flow model and underlying
prepayment and interest rate models used to value these MSRs are subject to
validation in accordance with the Company’s model validation policies.
The fair value of the MSRs is primarily affected by changes in
prepayments that result from shifts in mortgage interest rates. In managing
this risk, the Company economically hedges a significant portion of the
value of its MSRs through the use of interest rate derivative contracts, forward
purchase commitments of mortgage-backed securities and purchased
securities classified as trading.
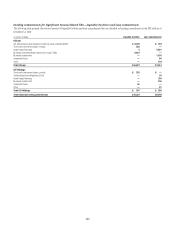
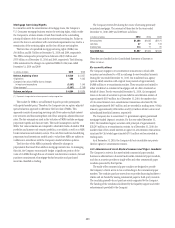
The Company receives fees during the course of servicing previously
securitized mortgages. The amounts of these fees for the years ended
December 31, 2010, 2009 and 2008 were as follows:
In millions of dollars 2010 2009 2008
Servicing fees $1,356 $1,635 $2,121
Late fees 87 93 123
Ancillary fees 214 77 81
Total MSR fees $1,657 $1,805 $2,325
These fees are classified in the Consolidated Statement of Income as
Other revenue.
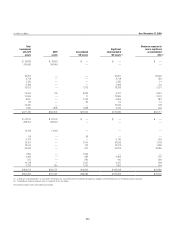
Re-securitizations
The Company engages in re-securitization transactions in which debt
securities are transferred to a VIE in exchange for new beneficial interests.
During the year ended December 31, 2010, Citi transferred non-agency
(private-label) securities with original loan proceeds of approximately
$4,868 million to re-securitization entities. These securities are backed by
either residential or commercial mortgages and are often structured on
behalf of clients. For the year ended December 31, 2010, Citi recognized
losses on the sale of securities to private-label re-securitization entities of
approximately $119 million. As of December 31, 2010, the market value
of Citi-owned interests in re-securitization transactions structured by Citi
totaled approximately $435 million and are recorded in trading assets. Of this
amount, approximately $104 million and $331 million relate to senior and
subordinated beneficial interests, respectively.
The Company also re-securitizes U.S. government-agency guaranteed
mortgage-backed (Agency) securities. For the year ended December 31,
2010, Citi transferred agency securities with principal of approximately
$28,295 million to re-securitization entities. As of December 31, 2010, the
market value of Citi-owned interests in agency re-securitization transactions
structured by Citi totaled approximately $351 million and are recorded in
trading assets.
As of December 31, 2010, the Company did not consolidate any private-
label or agency re-securitization entities.
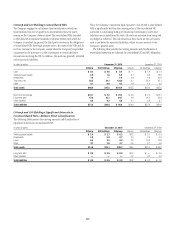
Citi-Administered Asset-Backed Commercial Paper Conduits
The Company is active in the asset-backed commercial paper conduit
business as administrator of several multi-seller commercial paper conduits,
and also as a service provider to single-seller and other commercial paper
conduits sponsored by third parties.
The multi-seller commercial paper conduits are designed to provide
the Company’s clients access to low-cost funding in the commercial paper
markets. The conduits purchase assets from or provide financing facilities to
clients and are funded by issuing commercial paper to third-party investors.
The conduits generally do not purchase assets originated by the Company.
The funding of the conduits is facilitated by the liquidity support and credit
enhancements provided by the Company.