Citibank 2010 Annual Report Download - page 266
Download and view the complete annual report
Please find page 266 of the 2010 Citibank annual report below. You can navigate through the pages in the report by either clicking on the pages listed below, or by using the keyword search tool below to find specific information within the annual report.-
 1
1 -
2
-
3
-
4
-
5
-
6
-
7
-
8
-
9
-
10
-
11
-
12
-
13
-
14
-
15
-
16
-
17
-
18
-
19
-
20
-
21
-
22
-
23
-
24
-
25
-
26
-
27
-
28
-
29
-
30
-
31
-
32
-
33
-
34
-
35
-
36
-
37
-
38
-
39
-
40
-
41
-
42
-
43
-
44
-
45
-
46
-
47
-
48
-
49
-
50
-
51
-
52
-
53
-
54
-
55
-
56
-
57
-
58
-
59
-
60
-
61
-
62
-
63
-
64
-
65
-
66
-
67
-
68
-
69
-
70
-
71
-
72
-
73
-
74
-
75
-
76
-
77
-
78
-
79
-
80
-
81
-
82
-
83
-
84
-
85
-
86
-
87
-
88
-
89
-
90
-
91
-
92
-
93
-
94
-
95
-
96
-
97
-
98
-
99
-
100
-
101
-
102
-
103
-
104
-
105
-
106
-
107
-
108
-
109
-
110
-
111
-
112
-
113
-
114
-
115
-
116
-
117
-
118
-
119
-
120
-
121
-
122
-
123
-
124
-
125
-
126
-
127
-
128
-
129
-
130
-
131
-
132
-
133
-
134
-
135
-
136
-
137
-
138
-
139
-
140
-
141
-
142
-
143
-
144
-
145
-
146
-
147
-
148
-
149
-
150
-
151
-
152
-
153
-
154
-
155
-
156
-
157
-
158
-
159
-
160
-
161
-
162
-
163
-
164
-
165
-
166
-
167
-
168
-
169
-
170
-
171
-
172
-
173
-
174
-
175
-
176
-
177
-
178
-
179
-
180
-
181
-
182
-
183
-
184
-
185
-
186
-
187
-
188
-
189
-
190
-
191
-
192
-
193
-
194
-
195
-
196
-
197
-
198
-
199
-
200
-
201
-
202
-
203
-
204
-
205
-
206
-
207
-
208
-
209
-
210
-
211
-
212
-
213
-
214
-
215
-
216
-
217
-
218
-
219
-
220
-
221
-
222
-
223
-
224
-
225
-
226
-
227
-
228
-
229
-
230
-
231
-
232
-
233
-
234
-
235
-
236
-
237
-
238
-
239
-
240
-
241
-
242
-
243
-
244
-
245
-
246
-
247
-
248
-
249
-
250
-
251
-
252
-
253
-
254
-
255
-
 256
256 -
 257
257 -
 258
258 -
 259
259 -
 260
260 -
 261
261 -
 262
262 -
 263
263 -
 264
264 -
 265
265 -
 266
266 -
 267
267 -
 268
268 -
 269
269 -
 270
270 -
 271
271 -
 272
272 -
 273
273 -
 274
274 -
 275
275 -
 276
276 -
277
-
278
-
279
-
280
-
281
-
282
-
283
-
284
-
285
-
286
-
287
-
288
-
289
-
290
-
291
-
292
-
293
-
294
-
295
-
296
-
297
-
298
-
299
-
300
-
301
-
302
-
303
-
304
-
305
-
306
-
307
-
308
-
309
-
310
-
311
-
312
 |
 |

264
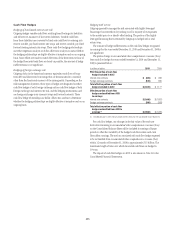
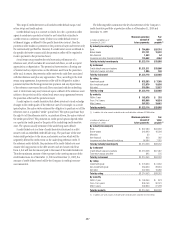
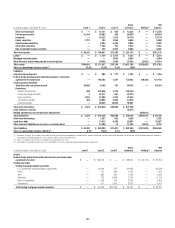
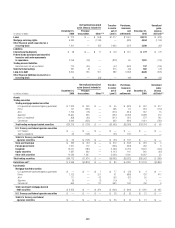
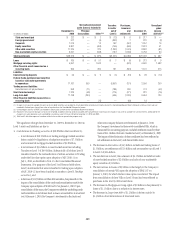
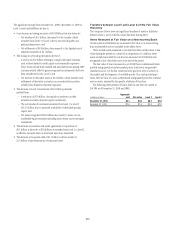
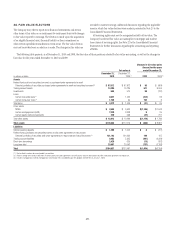
Items Measured at Fair Value on a Recurring Basis
The following tables present for each of the fair value hierarchy levels
the Company’s assets and liabilities that are measured at fair value on a
recurring basis at December 31, 2010 and 2009. The Company often hedges
positions that have been classified in the Level 3 category with financial
instruments that have been classified as Level 1 or Level 2. In addition,
the Company also hedges items classified in the Level 3 category with
instruments classified in Level 3 of the fair value hierarchy. The effects of
these hedges are presented gross in the following table.
In millions of dollars at December 31, 2010 Level 1 Level 2 Level 3
Gross
inventory Netting (1)
Net
balance
Assets
Federal funds sold and securities borrowed or purchased under
agreements to resell $ — $ 131,831 $ 4,911 $ 136,742 $ (49,230) $ 87,512
Trading securities
Trading mortgage-backed securities
U.S. government-sponsored agency guaranteed — 26,296 831 27,127 — 27,127
Prime — 920 594 1,514 — 1,514
Alt-A — 1,117 385 1,502 — 1,502
Subprime — 911 1,125 2,036 — 2,036
Non-U.S. residential — 828 224 1,052 — 1,052
Commercial — 883 418 1,301 — 1,301
Total trading mortgage-backed securities $ — $ 30,955 $ 3,577 $ 34,532 $ — $ 34,532
U.S. Treasury and federal agencies securities
U.S. Treasury $ 18,449 $ 1,719 $ — $ 20,168 $ — $ 20,168
Agency obligations 6 3,340 72 3,418 — 3,418
Total U.S. Treasury and federal agencies securities $ 18,455 $ 5,059 $ 72 $ 23,586 $ — $ 23,586
State and municipal $ — $ 7,285 $ 208 $ 7,493 $ — $ 7,493
Foreign government 64,096 23,649 566 88,311 — 88,311
Corporate — 45,580 6,006 51,586 — 51,586
Equity securities 33,509 4,291 776 38,576 — 38,576
Asset-backed securities — 1,141 6,618 7,759 — 7,759
Other debt securities — 13,911 1,305 15,216 — 15,216
Total trading securities $116,060 $ 131,871 $19,128 $ 267,059 $ — $267,059
Derivatives
Interest rate contracts $ 509 $ 473,579 $ 2,584 $ 476,672
Foreign exchange contracts 11 83,465 1,025 84,501
Equity contracts 2,581 11,807 1,758 16,146
Commodity contracts 590 10,973 1,045 12,608
Credit derivatives — 52,270 12,771 65,041
Total gross derivatives $ 3,691 $ 632,094 $19,183 $ 654,968
Cash collateral paid 50,302
Netting agreements and market value adjustments $(655,057)
Total derivatives $ 3,691 $ 632,094 $19,183 $ 705,270 $(655,057) $ 50,213
Investments
Mortgage-backed securities
U.S. government-sponsored agency guaranteed $ 70 $ 23,531 $ 22 $ 23,623 $ — $ 23,623
Prime — 1,660 166 1,826 — 1,826
Alt-A — 47 1 48 — 48
Subprime — 119 — 119 — 119
Non-U.S. residential — 316 — 316 — 316
Commercial — 47 527 574 — 574
Total investment mortgage-backed securities $ 70 $ 25,720 $ 716 $ 26,506 $ — $ 26,506
U.S. Treasury and federal agency securities
U.S. Treasury $ 14,031 $ 44,417 $ — $ 58,448 $ — $ 58,448
Agency obligations — 43,597 17 43,614 — 43,614
Total U.S. Treasury and federal agency $ 14,031 $ 88,014 $ 17 $ 102,062 $ — $102,062