Citibank 2010 Annual Report Download - page 37
Download and view the complete annual report
Please find page 37 of the 2010 Citibank annual report below. You can navigate through the pages in the report by either clicking on the pages listed below, or by using the keyword search tool below to find specific information within the annual report.-
 1
1 -
2
-
3
-
4
-
5
-
6
-
7
-
8
-
9
-
10
-
11
-
12
-
13
-
14
-
15
-
16
-
17
-
18
-
19
-
20
-
21
-
22
-
23
-
24
-
25
-
26
-
 27
27 -
 28
28 -
 29
29 -
 30
30 -
 31
31 -
 32
32 -
 33
33 -
 34
34 -
 35
35 -
 36
36 -
 37
37 -
 38
38 -
 39
39 -
 40
40 -
 41
41 -
 42
42 -
 43
43 -
 44
44 -
 45
45 -
 46
46 -
 47
47 -
48
-
49
-
50
-
51
-
52
-
53
-
54
-
55
-
56
-
57
-
58
-
59
-
60
-
61
-
62
-
63
-
64
-
65
-
66
-
67
-
68
-
69
-
70
-
71
-
72
-
73
-
74
-
75
-
76
-
77
-
78
-
79
-
80
-
81
-
82
-
83
-
84
-
85
-
86
-
87
-
88
-
89
-
90
-
91
-
92
-
93
-
94
-
95
-
96
-
97
-
98
-
99
-
100
-
101
-
102
-
103
-
104
-
105
-
106
-
107
-
108
-
109
-
110
-
111
-
112
-
113
-
114
-
115
-
116
-
117
-
118
-
119
-
120
-
121
-
122
-
123
-
124
-
125
-
126
-
127
-
128
-
129
-
130
-
131
-
132
-
133
-
134
-
135
-
136
-
137
-
138
-
139
-
140
-
141
-
142
-
143
-
144
-
145
-
146
-
147
-
148
-
149
-
150
-
151
-
152
-
153
-
154
-
155
-
156
-
157
-
158
-
159
-
160
-
161
-
162
-
163
-
164
-
165
-
166
-
167
-
168
-
169
-
170
-
171
-
172
-
173
-
174
-
175
-
176
-
177
-
178
-
179
-
180
-
181
-
182
-
183
-
184
-
185
-
186
-
187
-
188
-
189
-
190
-
191
-
192
-
193
-
194
-
195
-
196
-
197
-
198
-
199
-
200
-
201
-
202
-
203
-
204
-
205
-
206
-
207
-
208
-
209
-
210
-
211
-
212
-
213
-
214
-
215
-
216
-
217
-
218
-
219
-
220
-
221
-
222
-
223
-
224
-
225
-
226
-
227
-
228
-
229
-
230
-
231
-
232
-
233
-
234
-
235
-
236
-
237
-
238
-
239
-
240
-
241
-
242
-
243
-
244
-
245
-
246
-
247
-
248
-
249
-
250
-
251
-
252
-
253
-
254
-
255
-
256
-
257
-
258
-
259
-
260
-
261
-
262
-
263
-
264
-
265
-
266
-
267
-
268
-
269
-
270
-
271
-
272
-
273
-
274
-
275
-
276
-
277
-
278
-
279
-
280
-
281
-
282
-
283
-
284
-
285
-
286
-
287
-
288
-
289
-
290
-
291
-
292
-
293
-
294
-
295
-
296
-
297
-
298
-
299
-
300
-
301
-
302
-
303
-
304
-
305
-
306
-
307
-
308
-
309
-
310
-
311
-
312
 |
 |
35
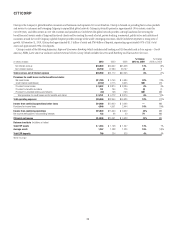
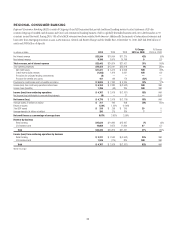
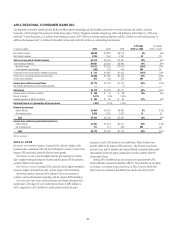
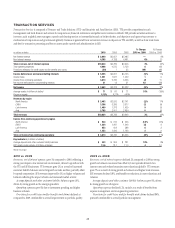
2009 vs. 2008
Revenues, net of interest expense were fairly flat as higher credit losses
in the securitization trusts were offset by higher net interest margin in
cards, higher volumes in retail banking, and higher gains from loan sales
in mortgages.
Net interest revenue was up 20% driven by the impact of pricing actions
relating to the CARD Act and lower funding costs in Citi-branded cards, and
by higher deposit and loan volumes in retail banking, with average deposits
up 12% and average loans up 11%.
Non-interest revenue declined 21%, driven by higher credit losses
flowing through the securitization trusts and by the absence of a
$349 million gain on the sale of Visa shares and a $170 million gain from
a cards portfolio sale in 2008. This decline was partially offset by higher
gains from loan sales in mortgages.
Operating expenses declined 34%. Excluding a 2008 goodwill
impairment charge of $2.3 billion, expenses were down 12% reflecting the
benefits from re-engineering efforts, lower marketing costs, and the absence
of $217 million of repositioning charges in 2008 offset by the absence of a
$159 million Visa litigation reserve release in 2008.
Provisions for credit losses and for benefits and claims increased
$642 million, or 59%, primarily due to rising net credit losses in both cards
and retail banking. The continued weakening of leading credit indicators and
trends in the macroeconomic environment during the period, including rising
unemployment and higher bankruptcy filings, drove higher credit costs. The
cards managed net credit loss ratio increased 376 basis points to 9.41%, while
the retail banking net credit loss ratio increased 44 basis points to 0.90%.