Citibank 2010 Annual Report Download - page 125
Download and view the complete annual report
Please find page 125 of the 2010 Citibank annual report below. You can navigate through the pages in the report by either clicking on the pages listed below, or by using the keyword search tool below to find specific information within the annual report.-
 1
1 -
2
-
3
-
4
-
5
-
6
-
7
-
8
-
9
-
10
-
11
-
12
-
13
-
14
-
15
-
16
-
17
-
18
-
19
-
20
-
21
-
22
-
23
-
24
-
25
-
26
-
27
-
28
-
29
-
30
-
31
-
32
-
33
-
34
-
35
-
36
-
37
-
38
-
39
-
40
-
41
-
42
-
43
-
44
-
45
-
46
-
47
-
48
-
49
-
50
-
51
-
52
-
53
-
54
-
55
-
56
-
57
-
58
-
59
-
60
-
61
-
62
-
63
-
64
-
65
-
66
-
67
-
68
-
69
-
70
-
71
-
72
-
73
-
74
-
75
-
76
-
77
-
78
-
79
-
80
-
81
-
82
-
83
-
84
-
85
-
86
-
87
-
88
-
89
-
90
-
91
-
92
-
93
-
94
-
95
-
96
-
97
-
98
-
99
-
100
-
101
-
102
-
103
-
104
-
105
-
106
-
107
-
108
-
109
-
110
-
111
-
112
-
113
-
114
-
 115
115 -
 116
116 -
 117
117 -
 118
118 -
 119
119 -
 120
120 -
 121
121 -
 122
122 -
 123
123 -
 124
124 -
 125
125 -
 126
126 -
 127
127 -
 128
128 -
 129
129 -
 130
130 -
 131
131 -
 132
132 -
 133
133 -
 134
134 -
 135
135 -
136
-
137
-
138
-
139
-
140
-
141
-
142
-
143
-
144
-
145
-
146
-
147
-
148
-
149
-
150
-
151
-
152
-
153
-
154
-
155
-
156
-
157
-
158
-
159
-
160
-
161
-
162
-
163
-
164
-
165
-
166
-
167
-
168
-
169
-
170
-
171
-
172
-
173
-
174
-
175
-
176
-
177
-
178
-
179
-
180
-
181
-
182
-
183
-
184
-
185
-
186
-
187
-
188
-
189
-
190
-
191
-
192
-
193
-
194
-
195
-
196
-
197
-
198
-
199
-
200
-
201
-
202
-
203
-
204
-
205
-
206
-
207
-
208
-
209
-
210
-
211
-
212
-
213
-
214
-
215
-
216
-
217
-
218
-
219
-
220
-
221
-
222
-
223
-
224
-
225
-
226
-
227
-
228
-
229
-
230
-
231
-
232
-
233
-
234
-
235
-
236
-
237
-
238
-
239
-
240
-
241
-
242
-
243
-
244
-
245
-
246
-
247
-
248
-
249
-
250
-
251
-
252
-
253
-
254
-
255
-
256
-
257
-
258
-
259
-
260
-
261
-
262
-
263
-
264
-
265
-
266
-
267
-
268
-
269
-
270
-
271
-
272
-
273
-
274
-
275
-
276
-
277
-
278
-
279
-
280
-
281
-
282
-
283
-
284
-
285
-
286
-
287
-
288
-
289
-
290
-
291
-
292
-
293
-
294
-
295
-
296
-
297
-
298
-
299
-
300
-
301
-
302
-
303
-
304
-
305
-
306
-
307
-
308
-
309
-
310
-
311
-
312
 |
 |

123
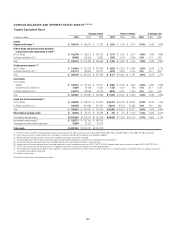
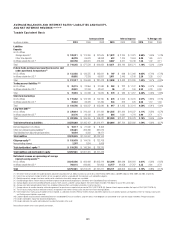
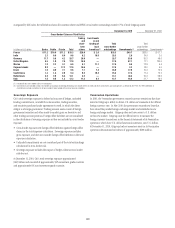
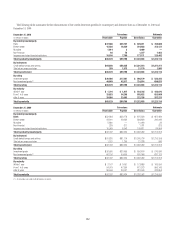
AVERAGE BALANCES AND INTEREST RATES—LIABILITIES AND EQUITY,
AND NET INTEREST REVENUE (1)(2)(3)(4)
Taxable Equivalent Basis
Average volume Interest expense % Average rate
In millions of dollars 2010 2009 2008 2010 2009 2008 2010 2009 2008
Liabilities
Deposits
In U.S. offices
Savings deposits (5) $ 189,311 $ 174,260 $ 167,509 $ 1,872 $ 2,765 $ 2,921 0.99% 1.59% 1.74%
Other time deposits 46,238 59,673 58,998 412 1,104 2,604 0.89 1.85 4.41
In offices outside the U.S. (6) 483,796 443,601 473,452 6,087 6,277 14,746 1.26 1.42 3.11
Total $ 719,345 $ 677,534 $ 699,959 $ 8,371 $10,146 $20,271 1.16% 1.50% 2.90%
Federal funds purchased and securities loaned or sold
under agreements to repurchase (7)
In U.S. offices $ 123,425 $ 133,375 $ 185,621 $ 797 $ 988 $ 5,066 0.65% 0.74% 2.73%
In offices outside the U.S. (6) 88,892 72,258 95,857 2,011 2,445 6,199 2.26 3.38 6.47
Total $ 212,317 $ 205,633 $ 281,478 $ 2,808 $ 3,433 $11,265 1.32% 1.67% 4.00%
Trading account liabilities (8)(9)
In U.S. offices $ 36,115 $ 22,854 $ 31,984 $ 283 $ 222 $ 1,107 0.78% 0.97% 3.46%
In offices outside the U.S. (6) 43,501 37,244 42,941 96 67 150 0.22 0.18 0.35
Total $ 79,616 $ 60,098 $ 74,925 $ 379 $ 289 $ 1,257 0.48% 0.48% 1.68%
Short-term borrowings
In U.S. offices $ 119,262 $ 123,168 $ 154,190 $ 674 $ 1,050 $ 3,241 0.57% 0.85% 2.10%
In offices outside the U.S. (6) 35,533 33,379 51,499 243 375 670 0.68 1.12 1.30
Total $ 154,795 $ 156,547 $ 205,689 $ 917 $ 1,425 $ 3,911 0.59% 0.91% 1.90%
Long-term debt (10)
In U.S. offices $ 370,819 $ 316,223 $ 311,439 $11,525 $11,326 $14,237 3.11% 3.58% 4.57%
In offices outside the U.S. (6) 22,176 29,132 36,981 864 1,081 1,741 3.90 3.71 4.71
Total $ 392,995 $ 345,355 $ 348,420 $12,389 $12,407 $15,978 3.15% 3.59% 4.59%
Total interest-bearing liabilities $1,559,068 $1,445,167 $1,610,471 $24,864 $27,700 $52,682 1.59% 1.92% 3.27%
Demand deposits in U.S. offices $ 16,117 $ 27,032 $ 8,308
Other non-interest-bearing liabilities (8) 245,481 263,296 381,912
Total liabilities from discontinued operations 18,410 9,502 28,471
Total liabilities $1,839,076 $1,744,997 $2,029,162
Citigroup equity (11) $ 156,478 $ 144,510 $ 132,708
Noncontrolling interest 2,307 1,874 5,608
Total stockholders’ equity (11) $ 158,785 $ 146,384 $ 138,316
Total liabilities and stockholders’ equity $1,997,861 $1,891,381 $2,167,478
Net interest revenue as a percentage of average
interest-earning assets (12)
In U.S. offices $1,043,486 $ 962,084 $1,005,414 $31,394 $24,648 $26,681 3.01% 2.56% 2.65%
In offices outside the U.S. (6) 709,115 649,995 731,903 23,777 24,958 27,767 3.35 3.84 3.79
Total $1,752,601 $1,612,079 $1,737,317 $55,171 $49,606 $54,448 3.15% 3.08% 3.13%
(1) Net interest revenue includes the taxable equivalent adjustments (based on the U.S. federal statutory tax rate of 35%) of $519 million, $692 million, and $699 million for 2010, 2009, and 2008, respectively.
(2) Interest rates and amounts include the effects of risk management activities associated with the respective asset and liability categories.
(3) Monthly or quarterly averages have been used by certain subsidiaries where daily averages are unavailable.
(4) Detailed average volume, interest revenue and interest expense exclude discontinued operations. See Note 3 to the Consolidated Financial Statements.
(5) Savings deposits consist of Insured Money Market accounts, NOW accounts, and other savings deposits. The interest expense includes FDIC deposit insurance fees and charges.
(6) Average rates reflect prevailing local interest rates, including inflationary effects and monetary corrections in certain countries.
(7) Average volumes of securities loaned or sold under agreements to repurchase are reported net pursuant to FIN 41 (ASC 210-20-45). However, Interest expense excludes the impact of FIN 41 (ASC 210-20-45).
(8) The fair value carrying amounts of derivative contracts are reported in non-interest-earning assets and other non-interest-bearing liabilities.
(9) Interest expense on Trading account liabilities of ICG is reported as a reduction of Interest Revenue. Interest revenue and interest expense on cash collateral positions are reported in interest on Trading account assets
and Trading account liabilities, respectively.
(10) Excludes hybrid financial instruments and beneficial interests in consolidated VIEs that are classified as Long-term debt, as these obligations are accounted for at fair value with changes recorded in Principal transactions.
(11) Includes stockholders’ equity from discontinued operations.
(12) Includes allocations for capital and funding costs based on the location of the asset.
Reclassified to conform to the current period’s presentation.