Citibank 2010 Annual Report Download - page 38
Download and view the complete annual report
Please find page 38 of the 2010 Citibank annual report below. You can navigate through the pages in the report by either clicking on the pages listed below, or by using the keyword search tool below to find specific information within the annual report.-
 1
1 -
 2
2 -
 3
3 -
 4
4 -
 5
5 -
 6
6 -
 7
7 -
 8
8 -
 9
9 -
 10
10 -
 11
11 -
 12
12 -
 13
13 -
 14
14 -
 15
15 -
 16
16 -
 17
17 -
 18
18 -
 19
19 -
 20
20 -
 21
21 -
 22
22 -
 23
23 -
 24
24 -
 25
25 -
 26
26 -
 27
27 -
 28
28 -
 29
29 -
 30
30 -
 31
31 -
 32
32 -
 33
33 -
 34
34 -
 35
35 -
 36
36 -
 37
37 -
 38
38 -
 39
39 -
 40
40 -
 41
41 -
 42
42 -
 43
43 -
 44
44 -
 45
45 -
 46
46 -
 47
47 -
 48
48 -
 49
49 -
 50
50 -
 51
51 -
 52
52 -
 53
53 -
 54
54 -
 55
55 -
 56
56 -
 57
57 -
 58
58 -
 59
59 -
 60
60 -
 61
61 -
 62
62 -
 63
63 -
 64
64 -
 65
65 -
 66
66 -
 67
67 -
 68
68 -
 69
69 -
 70
70 -
 71
71 -
 72
72 -
 73
73 -
 74
74 -
 75
75 -
 76
76 -
 77
77 -
 78
78 -
 79
79 -
 80
80 -
 81
81 -
 82
82 -
 83
83 -
 84
84 -
 85
85 -
 86
86 -
 87
87 -
 88
88 -
 89
89 -
 90
90 -
 91
91 -
 92
92 -
 93
93 -
 94
94 -
 95
95 -
 96
96 -
 97
97 -
 98
98 -
 99
99 -
 100
100 -
 101
101 -
 102
102 -
 103
103 -
 104
104 -
 105
105 -
 106
106 -
 107
107 -
 108
108 -
 109
109 -
 110
110 -
 111
111 -
 112
112 -
 113
113 -
 114
114 -
 115
115 -
 116
116 -
 117
117 -
 118
118 -
 119
119 -
 120
120 -
 121
121 -
 122
122 -
 123
123 -
 124
124 -
 125
125 -
 126
126 -
 127
127 -
 128
128 -
 129
129 -
 130
130 -
 131
131 -
 132
132 -
 133
133 -
 134
134 -
 135
135 -
 136
136 -
 137
137 -
 138
138 -
 139
139 -
 140
140 -
 141
141 -
 142
142 -
 143
143 -
 144
144 -
 145
145 -
 146
146 -
 147
147 -
 148
148 -
 149
149 -
 150
150 -
 151
151 -
 152
152 -
 153
153 -
 154
154 -
 155
155 -
 156
156 -
 157
157 -
 158
158 -
 159
159 -
 160
160 -
 161
161 -
 162
162 -
 163
163 -
 164
164 -
 165
165 -
 166
166 -
 167
167 -
 168
168 -
 169
169 -
 170
170 -
 171
171 -
 172
172 -
 173
173 -
 174
174 -
 175
175 -
 176
176 -
 177
177 -
 178
178 -
 179
179 -
 180
180 -
 181
181 -
 182
182 -
 183
183 -
 184
184 -
 185
185 -
 186
186 -
 187
187 -
 188
188 -
 189
189 -
 190
190 -
 191
191 -
 192
192 -
 193
193 -
 194
194 -
 195
195 -
 196
196 -
 197
197 -
 198
198 -
 199
199 -
 200
200 -
 201
201 -
 202
202 -
 203
203 -
 204
204 -
 205
205 -
 206
206 -
 207
207 -
 208
208 -
 209
209 -
 210
210 -
 211
211 -
 212
212 -
 213
213 -
 214
214 -
 215
215 -
 216
216 -
 217
217 -
 218
218 -
 219
219 -
 220
220 -
 221
221 -
 222
222 -
 223
223 -
 224
224 -
 225
225 -
 226
226 -
 227
227 -
 228
228 -
 229
229 -
 230
230 -
 231
231 -
 232
232 -
 233
233 -
 234
234 -
 235
235 -
 236
236 -
 237
237 -
 238
238 -
 239
239 -
 240
240 -
 241
241 -
 242
242 -
 243
243 -
 244
244 -
 245
245 -
 246
246 -
 247
247 -
 248
248 -
 249
249 -
 250
250 -
 251
251 -
 252
252 -
 253
253 -
 254
254 -
 255
255 -
 256
256 -
 257
257 -
 258
258 -
 259
259 -
 260
260 -
 261
261 -
 262
262 -
 263
263 -
 264
264 -
 265
265 -
 266
266 -
 267
267 -
 268
268 -
 269
269 -
 270
270 -
 271
271 -
 272
272 -
 273
273 -
 274
274 -
 275
275 -
 276
276 -
 277
277 -
 278
278 -
 279
279 -
 280
280 -
 281
281 -
 282
282 -
 283
283 -
 284
284 -
 285
285 -
 286
286 -
 287
287 -
 288
288 -
 289
289 -
 290
290 -
 291
291 -
 292
292 -
 293
293 -
 294
294 -
 295
295 -
 296
296 -
 297
297 -
 298
298 -
 299
299 -
 300
300 -
 301
301 -
 302
302 -
 303
303 -
 304
304 -
 305
305 -
 306
306 -
 307
307 -
 308
308 -
 309
309 -
 310
310 -
 311
311 -
 312
312
 |
 |

36
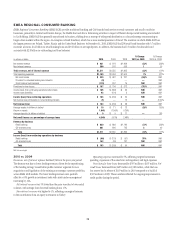
EMEA REGIONAL CONSUMER BANKING
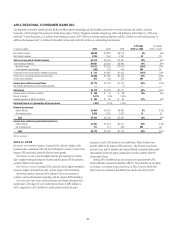
EMEA Regional Consumer Banking (EMEA RCB) provides traditional banking and Citi-branded card services to retail customers and small to mid-size
businesses, primarily in Central and Eastern Europe, the Middle East and Africa. Remaining activities in respect of Western Europe retail banking are included
in Citi Holdings. EMEA RCB has generally repositioned its business, shifting from a strategy of widespread distribution to a focused strategy concentrating on
larger urban markets within the region. An exception is Bank Handlowy, which has a mass market presence in Poland. The countries in which EMEA RCB has
the largest presence are Poland, Turkey, Russia and the United Arab Emirates. At December 31, 2010, EMEA RCB had 298 retail bank branches with 3.7 million
customer accounts, $4.4 billion in retail banking loans and $9.2 billion in average deposits. In addition, the business had 2.5 million Citi-branded card
accounts with $2.8 billion in outstanding card loan balances.
In millions of dollars 2010 2009 2008
% Change
2010 vs. 2009
% Change
2009 vs. 2008
Net interest revenue $ 931 $ 979 $1,269 (5)% (23)%
Non-interest revenue 580 576 596 1(3)
Total revenues, net of interest expense $1,511 $1,555 $1,865 (3)% (17)%
Total operating expenses $1,169 $1,094 $1,500 7% (27)%
Net credit losses $ 320 $ 487 $ 237 (34)% NM
Provision for unfunded lending commitments (4) — — —NM
Credit reserve build (release) (119) 307 75 NM NM
Provisions for loan losses $ 197 $ 794 $ 312 (75)% NM
Income (loss) from continuing operations before taxes $ 145 $ (333) $ 53 NM NM
Income taxes (benefits) 42 (124) 3 NM NM
Income (loss) from continuing operations $ 103 $ (209) $ 50 NM NM
Net income (loss) attributable to noncontrolling interests (1) — 12 —(100)%
Net income (loss) $ 104 $ (209) $ 38 NM NM
Average assets (in billions of dollars) $ 10 $ 11 $ 13 (9)% (15)%
Return on assets 1.04% (1.90)% 0.29%
Average deposits (in billions of dollars) $ 9 $ 9 $ 11 — (18)
Net credit losses as a percentage of average loans 4.34% 5.81% 2.48%
Revenue by business
Retail banking $ 830 $ 889 $1,160 (7)% (23)%
Citi-branded cards 681 666 705 2(6)
Total $1,511 $1,555 $1,865 (3)% (17)%
Income (loss) from continuing operations by business
Retail banking $ (40) $ (179) $ (57) 78% NM
Citi-branded cards 143 (30) 107 NM NM
Total $ 103 $ (209) $ 50 NM NM
NM Not meaningful
2010 vs. 2009
Revenues, net of interest expense declined 3% from the prior-year period.
The decrease was due to lower lending revenues, driven by the repositioning
of the lending strategy toward better profile customer segments for new
acquisitions and liquidation of the existing non-strategic customer portfolios,
across EMEA RCB markets. The lower lending revenues were partially
offset by a 45% growth in investment sales with assets under management
increasing by 14%.
Net interest revenue was 5% lower than the prior year due to lower retail
volumes, with average loans for retail banking down 17%.
Non-interest revenue was higher by 1%, reflecting a marginal increase
in the contribution from an equity investment in Turkey.
Operating expenses increased by 7%, reflecting targeted investment
spending, expansion of the sales force and regulatory and legal expenses.
Provisions for loan losses decreased by $597 million to $197 million. Net
credit losses decreased from $487 million to $320 million, while the loan
loss reserve had a release of $119 million in 2010 compared to a build of
$307 million in 2009. These numbers reflected the ongoing improvement in
credit quality during the period.
