Citibank 2010 Annual Report Download - page 259
Download and view the complete annual report
Please find page 259 of the 2010 Citibank annual report below. You can navigate through the pages in the report by either clicking on the pages listed below, or by using the keyword search tool below to find specific information within the annual report.-
 1
1 -
2
-
3
-
4
-
5
-
6
-
7
-
8
-
9
-
10
-
11
-
12
-
13
-
14
-
15
-
16
-
17
-
18
-
19
-
20
-
21
-
22
-
23
-
24
-
25
-
26
-
27
-
28
-
29
-
30
-
31
-
32
-
33
-
34
-
35
-
36
-
37
-
38
-
39
-
40
-
41
-
42
-
43
-
44
-
45
-
46
-
47
-
48
-
49
-
50
-
51
-
52
-
53
-
54
-
55
-
56
-
57
-
58
-
59
-
60
-
61
-
62
-
63
-
64
-
65
-
66
-
67
-
68
-
69
-
70
-
71
-
72
-
73
-
74
-
75
-
76
-
77
-
78
-
79
-
80
-
81
-
82
-
83
-
84
-
85
-
86
-
87
-
88
-
89
-
90
-
91
-
92
-
93
-
94
-
95
-
96
-
97
-
98
-
99
-
100
-
101
-
102
-
103
-
104
-
105
-
106
-
107
-
108
-
109
-
110
-
111
-
112
-
113
-
114
-
115
-
116
-
117
-
118
-
119
-
120
-
121
-
122
-
123
-
124
-
125
-
126
-
127
-
128
-
129
-
130
-
131
-
132
-
133
-
134
-
135
-
136
-
137
-
138
-
139
-
140
-
141
-
142
-
143
-
144
-
145
-
146
-
147
-
148
-
149
-
150
-
151
-
152
-
153
-
154
-
155
-
156
-
157
-
158
-
159
-
160
-
161
-
162
-
163
-
164
-
165
-
166
-
167
-
168
-
169
-
170
-
171
-
172
-
173
-
174
-
175
-
176
-
177
-
178
-
179
-
180
-
181
-
182
-
183
-
184
-
185
-
186
-
187
-
188
-
189
-
190
-
191
-
192
-
193
-
194
-
195
-
196
-
197
-
198
-
199
-
200
-
201
-
202
-
203
-
204
-
205
-
206
-
207
-
208
-
209
-
210
-
211
-
212
-
213
-
214
-
215
-
216
-
217
-
218
-
219
-
220
-
221
-
222
-
223
-
224
-
225
-
226
-
227
-
228
-
229
-
230
-
231
-
232
-
233
-
234
-
235
-
236
-
237
-
238
-
239
-
240
-
241
-
242
-
243
-
244
-
245
-
246
-
247
-
248
-
 249
249 -
 250
250 -
 251
251 -
 252
252 -
 253
253 -
 254
254 -
 255
255 -
 256
256 -
 257
257 -
 258
258 -
 259
259 -
 260
260 -
 261
261 -
 262
262 -
 263
263 -
 264
264 -
 265
265 -
 266
266 -
 267
267 -
 268
268 -
 269
269 -
270
-
271
-
272
-
273
-
274
-
275
-
276
-
277
-
278
-
279
-
280
-
281
-
282
-
283
-
284
-
285
-
286
-
287
-
288
-
289
-
290
-
291
-
292
-
293
-
294
-
295
-
296
-
297
-
298
-
299
-
300
-
301
-
302
-
303
-
304
-
305
-
306
-
307
-
308
-
309
-
310
-
311
-
312
 |
 |

257
The range of credit derivatives sold includes credit default swaps, total
return swaps and credit options.
A credit default swap is a contract in which, for a fee, a protection seller
agrees to reimburse a protection buyer for any losses that occur due to
a credit event on a reference entity. If there is no credit default event or
settlement trigger, as defined by the specific derivative contract, then the
protection seller makes no payments to the protection buyer and receives only
the contractually specified fee. However, if a credit event occurs as defined in
the specific derivative contract sold, the protection seller will be required to
make a payment to the protection buyer.
A total return swap transfers the total economic performance of a
reference asset, which includes all associated cash flows, as well as capital
appreciation or depreciation. The protection buyer receives a floating rate
of interest and any depreciation on the reference asset from the protection
seller and, in return, the protection seller receives the cash flows associated
with the reference asset plus any appreciation. Thus, according to the total
return swap agreement, the protection seller will be obligated to make a
payment anytime the floating interest rate payment and any depreciation
of the reference asset exceed the cash flows associated with the underlying
asset. A total return swap may terminate upon a default of the reference asset
subject to the provisions of the related total return swap agreement between
the protection seller and the protection buyer.
A credit option is a credit derivative that allows investors to trade or hedge
changes in the credit quality of the reference asset. For example, in a credit
spread option, the option writer assumes the obligation to purchase or sell the
reference asset at a specified “strike” spread level. The option purchaser buys
the right to sell the reference asset to, or purchase it from, the option writer at
the strike spread level. The payments on credit spread options depend either
on a particular credit spread or the price of the underlying credit-sensitive
asset. The options usually terminate if the underlying assets default.
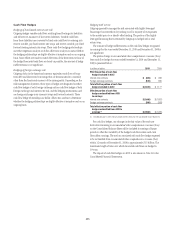
A credit-linked note is a form of credit derivative structured as a debt
security with an embedded credit default swap. The purchaser of the note
writes credit protection to the issuer, and receives a return which will be
negatively affected by credit events on the underlying reference credit. If
the reference entity defaults, the purchaser of the credit-linked note may
assume the long position in the debt security and any future cash flows
from it, but will lose the amount paid to the issuer of the credit-linked note.
Thus the maximum amount of the exposure is the carrying amount of the
credit-linked note. As of December 31, 2010 and December 31, 2009, the
amount of credit-linked notes held by the Company in trading inventory
was immaterial.
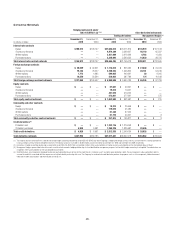
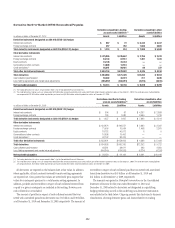
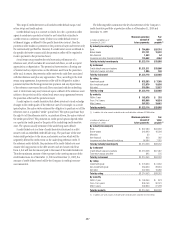
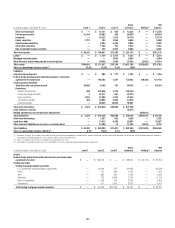
The following tables summarize the key characteristics of the Company’s
credit derivative portfolio as protection seller as of December 31, 2010 and
December 31, 2009:
In millions of dollars as of
December 31, 2010
Maximum potential
amount of
future payments
Fair
value
payable (1)
By industry/counterparty
Bank $ 784,080 $20,718
Broker-dealer 312,131 10,232
Non-financial 1,463 54
Insurance and other financial institutions 125,442 4,954
Total by industry/counterparty $1,223,116 $35,958
By instrument
Credit default swaps and options $1,221,211 $35,800
Total return swaps and other 1,905 158
Total by instrument $1,223,116 $35,958
By rating
Investment grade $ 532,283 $ 7,385
Non-investment grade 372,579 15,636
Not rated 318,254 12,937
Total by rating $1,223,116 $35,958
By maturity
Within 1 year $ 162,075 $ 353
From 1 to 5 years 853,808 16,524
After 5 years 207,233 19,081
Total by maturity $1,223,116 $35,958
(1) In addition, fair value amounts receivable under credit derivatives sold were $22,638 million.
In millions of dollars as of
December 31, 2009
Maximum potential
amount of
future payments
Fair
value
payable (1)
By industry/counterparty
Bank $ 807,484 $34,666
Broker-dealer 340,949 16,309
Monoline 33 —
Non-financial 623 262
Insurance and other financial institutions 64,964 7,025
Total by industry/counterparty $1,214,053 $58,262
By instrument
Credit default swaps and options $1,213,208 $57,987
Total return swaps and other 845 275
Total by instrument $1,214,053 $58,262
By rating
Investment grade $ 576,930 $ 9,632
Non-investment grade 339,920 28,664
Not rated 297,203 19,966
Total by rating $1,214,053 $58,262
By maturity
Within 1 year $ 165,056 $ 873
From 1 to 5 years 806,143 30,181
After 5 years 242,854 27,208
Total by maturity $1,214,053 $58,262
(1) In addition, fair value amounts receivable under credit derivatives sold were $24,234 million.