Citibank 2010 Annual Report Download - page 240
Download and view the complete annual report
Please find page 240 of the 2010 Citibank annual report below. You can navigate through the pages in the report by either clicking on the pages listed below, or by using the keyword search tool below to find specific information within the annual report.-
 1
1 -
2
-
3
-
4
-
5
-
6
-
7
-
8
-
9
-
10
-
11
-
12
-
13
-
14
-
15
-
16
-
17
-
18
-
19
-
20
-
21
-
22
-
23
-
24
-
25
-
26
-
27
-
28
-
29
-
30
-
31
-
32
-
33
-
34
-
35
-
36
-
37
-
38
-
39
-
40
-
41
-
42
-
43
-
44
-
45
-
46
-
47
-
48
-
49
-
50
-
51
-
52
-
53
-
54
-
55
-
56
-
57
-
58
-
59
-
60
-
61
-
62
-
63
-
64
-
65
-
66
-
67
-
68
-
69
-
70
-
71
-
72
-
73
-
74
-
75
-
76
-
77
-
78
-
79
-
80
-
81
-
82
-
83
-
84
-
85
-
86
-
87
-
88
-
89
-
90
-
91
-
92
-
93
-
94
-
95
-
96
-
97
-
98
-
99
-
100
-
101
-
102
-
103
-
104
-
105
-
106
-
107
-
108
-
109
-
110
-
111
-
112
-
113
-
114
-
115
-
116
-
117
-
118
-
119
-
120
-
121
-
122
-
123
-
124
-
125
-
126
-
127
-
128
-
129
-
130
-
131
-
132
-
133
-
134
-
135
-
136
-
137
-
138
-
139
-
140
-
141
-
142
-
143
-
144
-
145
-
146
-
147
-
148
-
149
-
150
-
151
-
152
-
153
-
154
-
155
-
156
-
157
-
158
-
159
-
160
-
161
-
162
-
163
-
164
-
165
-
166
-
167
-
168
-
169
-
170
-
171
-
172
-
173
-
174
-
175
-
176
-
177
-
178
-
179
-
180
-
181
-
182
-
183
-
184
-
185
-
186
-
187
-
188
-
189
-
190
-
191
-
192
-
193
-
194
-
195
-
196
-
197
-
198
-
199
-
200
-
201
-
202
-
203
-
204
-
205
-
206
-
207
-
208
-
209
-
210
-
211
-
212
-
213
-
214
-
215
-
216
-
217
-
218
-
219
-
220
-
221
-
222
-
223
-
224
-
225
-
226
-
227
-
228
-
229
-
 230
230 -
 231
231 -
 232
232 -
 233
233 -
 234
234 -
 235
235 -
 236
236 -
 237
237 -
 238
238 -
 239
239 -
 240
240 -
 241
241 -
 242
242 -
 243
243 -
 244
244 -
 245
245 -
 246
246 -
 247
247 -
 248
248 -
 249
249 -
 250
250 -
251
-
252
-
253
-
254
-
255
-
256
-
257
-
258
-
259
-
260
-
261
-
262
-
263
-
264
-
265
-
266
-
267
-
268
-
269
-
270
-
271
-
272
-
273
-
274
-
275
-
276
-
277
-
278
-
279
-
280
-
281
-
282
-
283
-
284
-
285
-
286
-
287
-
288
-
289
-
290
-
291
-
292
-
293
-
294
-
295
-
296
-
297
-
298
-
299
-
300
-
301
-
302
-
303
-
304
-
305
-
306
-
307
-
308
-
309
-
310
-
311
-
312
 |
 |

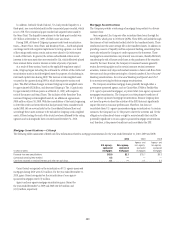
238
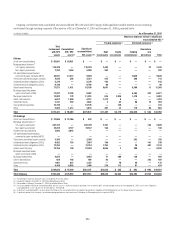
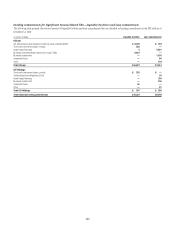
The following table summarizes selected cash flow information related to
Citicorp’s credit card securitizations for the years ended December 31, 2010,
2009 and 2008:
In billions of dollars 2010 2009 2008
Proceeds from new securitizations $ — $ 16.3 $ 11.8
Paydown of maturing notes (24.5) N/A N/A
Proceeds from collections reinvested in
new receivables N/A 144.4 165.6
Contractual servicing fees received N/A 1.3 1.3
Cash flows received on retained
interests and other net cash flows N/A 3.1 3.9
N/A Not applicable due to the adoption of SFAS 167
With the adoption of SFAS 167 in 2010 and resulting consolidation of
the credit card securitization trusts, there was no residual interest in the
securitized assets for Citicorp. Under previous accounting standards, the
residual interest was recorded at $0 for Citicorp as of December 31, 2009.
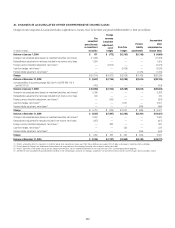
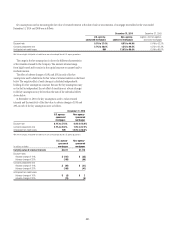
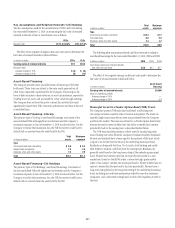
Credit Card Securitizations—Citi Holdings
No gains or losses from securitizations were recorded in 2010, since the
transfer of credit card receivables to the trust did not meet criteria for sale
accounting. The Company recorded net losses from securitization of Citi
Holdings’ credit card receivables of $(586) million and $(527) million for
the years ended December 31, 2009 and 2008, respectively.
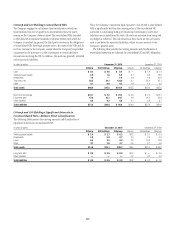
The following table summarizes selected cash flow information related
to Citi Holdings’ credit card securitizations for the years ended December 31,
2010, 2009 and 2008:
In billions of dollars 2010 2009 2008
Proceeds from new securitizations $ 5.5 $29.4 $16.9
Paydown of maturing notes (15.8) N/A N/A
Proceeds from collections reinvested
in new receivables N/A 46.0 49.1
Contractual servicing fees received N/A 0.7 0.7
Cash flows received on retained
interests and other net cash flows N/A 2.6 3.3
N/A Not applicable due to the adoption of SFAS 167
Similar to Citicorp, with the adoption of SFAS 167 in 2010 there was
no residual interest in securitized credit card receivables for Citi Holdings.
Under previous accounting standards, the residual interest was recorded at
$786 million as of December 31, 2009. Key assumptions used in measuring
the fair value of the residual interest at the date of sale or securitization of
Citi Holdings’ credit card receivables for the years ended December 31, 2010
and 2009, respectively, are as follows:
December 31,
2010
December 31,
2009
Discount rate N/A 19.7%
Constant prepayment rate N/A 6.0% to 11.0%
Anticipated net credit losses N/A 9.9% to 13.2%
N/A Not applicable due to the adoption of SFAS 167
The constant prepayment rate assumption range reflects the projected
payment rates over the life of a credit card balance, excluding new card
purchases. This results in a high payment in the early life of the securitized
balances followed by a much lower payment rate, which is depicted in the
disclosed range.
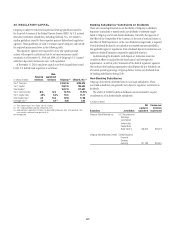
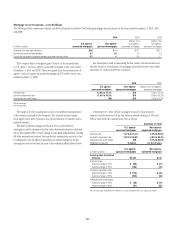
Managed Loans
As previously mentioned, prior to 2010, securitized receivables were treated as
sold and removed from the balance sheet. Beginning in 2010, substantially
all securitized credit card receivables are included in the Consolidated
Balance Sheet. Accordingly, the managed-basis (managed) presentation is
only relevant prior to 2010.
After securitization of credit card receivables, the Company continues to
maintain credit card customer account relationships and provides servicing
for receivables transferred to the trusts. As a result, the Company considers the
securitized credit card receivables to be part of the business it manages.
Managed presentations are non-GAAP financial measures. Managed
presentations include results from both the on-balance-sheet loans and off-
balance-sheet loans, and exclude the impact of card securitization activity.
Managed presentations assume that securitized loans have not been sold and
present the results of the securitized loans in the same manner as Citigroup’s
owned loans. Citigroup’s management believes that managed presentations
provide a greater understanding of ongoing operations and enhance
comparability of those results in prior periods as well as demonstrating the
effects of unusual gains and charges in the current period. Management
further believes that a meaningful analysis of the Company’s financial
performance requires an understanding of the factors underlying that
performance and that investors find it useful to see these non-GAAP financial
measures to analyze financial performance without the impact of unusual
items that may obscure trends in Citigroup’s underlying performance.
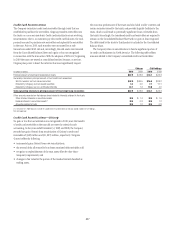
Managed Loans—Citicorp
The following tables present a reconciliation between the managed and
on-balance-sheet credit card portfolios and the related delinquencies (loans
which are 90 days or more past due) and credit losses, net of recoveries:
In millions of dollars, except loans in billions
December 31,
2010
December 31,
2009
Loan amounts, at period end
On balance sheet $114.2 $ 44.0
Securitized amounts —71.6
Total managed loans $114.2 $115.6
Delinquencies, at period end
On balance sheet $2,161 $ 1,146
Securitized amounts —1,902
Total managed delinquencies $2,161 $ 3,048
Credit losses, net of recoveries,
for the years ended December 31, 2010 2009 2008
On balance sheet $ 9,950 $ 3,841 $ 2,866
Securitized amounts —6,932 4,300
Total managed credit losses $ 9,950 $10,773 $ 7,166