Citibank 2010 Annual Report Download - page 117
Download and view the complete annual report
Please find page 117 of the 2010 Citibank annual report below. You can navigate through the pages in the report by either clicking on the pages listed below, or by using the keyword search tool below to find specific information within the annual report.-
 1
1 -
2
-
3
-
4
-
5
-
6
-
7
-
8
-
9
-
10
-
11
-
12
-
13
-
14
-
15
-
16
-
17
-
18
-
19
-
20
-
21
-
22
-
23
-
24
-
25
-
26
-
27
-
28
-
29
-
30
-
31
-
32
-
33
-
34
-
35
-
36
-
37
-
38
-
39
-
40
-
41
-
42
-
43
-
44
-
45
-
46
-
47
-
48
-
49
-
50
-
51
-
52
-
53
-
54
-
55
-
56
-
57
-
58
-
59
-
60
-
61
-
62
-
63
-
64
-
65
-
66
-
67
-
68
-
69
-
70
-
71
-
72
-
73
-
74
-
75
-
76
-
77
-
78
-
79
-
80
-
81
-
82
-
83
-
84
-
85
-
86
-
87
-
88
-
89
-
90
-
91
-
92
-
93
-
94
-
95
-
96
-
97
-
98
-
99
-
100
-
101
-
102
-
103
-
104
-
105
-
106
-
 107
107 -
 108
108 -
 109
109 -
 110
110 -
 111
111 -
 112
112 -
 113
113 -
 114
114 -
 115
115 -
 116
116 -
 117
117 -
 118
118 -
 119
119 -
 120
120 -
 121
121 -
 122
122 -
 123
123 -
 124
124 -
 125
125 -
 126
126 -
 127
127 -
128
-
129
-
130
-
131
-
132
-
133
-
134
-
135
-
136
-
137
-
138
-
139
-
140
-
141
-
142
-
143
-
144
-
145
-
146
-
147
-
148
-
149
-
150
-
151
-
152
-
153
-
154
-
155
-
156
-
157
-
158
-
159
-
160
-
161
-
162
-
163
-
164
-
165
-
166
-
167
-
168
-
169
-
170
-
171
-
172
-
173
-
174
-
175
-
176
-
177
-
178
-
179
-
180
-
181
-
182
-
183
-
184
-
185
-
186
-
187
-
188
-
189
-
190
-
191
-
192
-
193
-
194
-
195
-
196
-
197
-
198
-
199
-
200
-
201
-
202
-
203
-
204
-
205
-
206
-
207
-
208
-
209
-
210
-
211
-
212
-
213
-
214
-
215
-
216
-
217
-
218
-
219
-
220
-
221
-
222
-
223
-
224
-
225
-
226
-
227
-
228
-
229
-
230
-
231
-
232
-
233
-
234
-
235
-
236
-
237
-
238
-
239
-
240
-
241
-
242
-
243
-
244
-
245
-
246
-
247
-
248
-
249
-
250
-
251
-
252
-
253
-
254
-
255
-
256
-
257
-
258
-
259
-
260
-
261
-
262
-
263
-
264
-
265
-
266
-
267
-
268
-
269
-
270
-
271
-
272
-
273
-
274
-
275
-
276
-
277
-
278
-
279
-
280
-
281
-
282
-
283
-
284
-
285
-
286
-
287
-
288
-
289
-
290
-
291
-
292
-
293
-
294
-
295
-
296
-
297
-
298
-
299
-
300
-
301
-
302
-
303
-
304
-
305
-
306
-
307
-
308
-
309
-
310
-
311
-
312
 |
 |

115
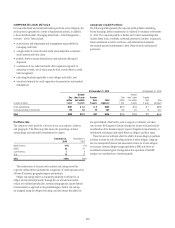
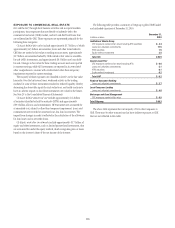
The following table presents the corporate credit portfolio by facility risk
rating at December 31, 2010 and 2009, as a percentage of the total portfolio:
Direct outstandings and
unfunded commitments
December 31,
2010
December 31,
2009
AAA/AA/A 56% 58%
BBB 26 24
BB/B 13 11
CCC or below 57
Unrated ——
Total 100% 100%
The corporate credit portfolio is diversified by industry, with a
concentration only in the financial sector, including banks, other financial
institutions, insurance companies, investment banks and government and
central banks. The following table shows the allocation of direct outstandings
and unfunded commitments to industries as a percentage of the total
corporate portfolio:
Direct outstandings and
unfunded commitments
December 31,
2010
December 31,
2009
Government and central banks 12% 12%
Banks 10 9
Other financial institutions 10 12
Investment banks 85
Petroleum 54
Insurance 44
Utilities 44
Agriculture and food preparation 44
Real estate 33
Telephone and cable 33
Industrial machinery and equipment 32
Global information technology 22
Metals 22
Other industries (1) 30 34
Total 100% 100%
(1) Includes all other industries, none of which exceeds 2% of total outstandings.
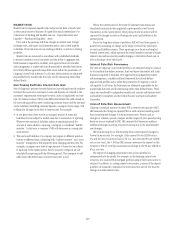
Credit Risk Mitigation
As part of its overall risk management activities, Citigroup uses credit
derivatives and other risk mitigants to hedge portions of the credit risk in its
portfolio, in addition to outright asset sales. The purpose of these transactions
is to transfer credit risk to third parties. The results of the mark to market and
any realized gains or losses on credit derivatives are reflected in the Principal
transactions line on the Consolidated Statement of Income.
At December 31, 2010 and 2009, $49.0 billion and $59.6 billion,
respectively, of credit risk exposures were economically hedged. Citigroup’s
expected loss model used in the calculation of its loan loss reserve does not
include the favorable impact of credit derivatives and other risk mitigants.
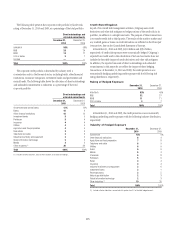
In addition, the reported amounts of direct outstandings and unfunded
commitments in this report do not reflect the impact of these hedging
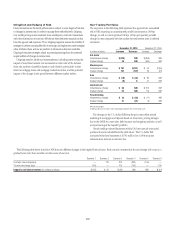
transactions. At December 31, 2010 and 2009, the credit protection was
economically hedging underlying credit exposure with the following risk
rating distribution, respectively:
Rating of Hedged Exposure
December 31,
2010
December 31,
2009
AAA/AA/A 53% 45%
BBB 32 37
BB/B 11 11
CCC or below 47
Total 100% 100%
At December 31, 2010 and 2009, the credit protection was economically
hedging underlying credit exposures with the following industry distribution,
respectively:
Industry of Hedged Exposure
December 31,
2010
December 31,
2009
Government 12% 0%
Other financial institutions 84
Agriculture and food preparation 78
Telephone and cable 69
Utilities 69
Autos 66
Metals 54
Chemicals 58
Petroleum 56
Retail 44
Insurance 44
Industrial machinery and equipment 36
Investment banks 31
Pharmaceuticals 35
Natural gas distribution 23
Global information technology 23
Other industries (1) 19 20
Total 100% 100%
(1) Includes all other industries, none of which is greater than 2% of the total hedged amount.