Citibank 2010 Annual Report Download - page 42
Download and view the complete annual report
Please find page 42 of the 2010 Citibank annual report below. You can navigate through the pages in the report by either clicking on the pages listed below, or by using the keyword search tool below to find specific information within the annual report.-
 1
1 -
2
-
3
-
4
-
5
-
6
-
7
-
8
-
9
-
10
-
11
-
12
-
13
-
14
-
15
-
16
-
17
-
18
-
19
-
20
-
21
-
22
-
23
-
24
-
25
-
26
-
27
-
28
-
29
-
30
-
31
-
 32
32 -
 33
33 -
 34
34 -
 35
35 -
 36
36 -
 37
37 -
 38
38 -
 39
39 -
 40
40 -
 41
41 -
 42
42 -
 43
43 -
 44
44 -
 45
45 -
 46
46 -
 47
47 -
 48
48 -
 49
49 -
 50
50 -
 51
51 -
 52
52 -
53
-
54
-
55
-
56
-
57
-
58
-
59
-
60
-
61
-
62
-
63
-
64
-
65
-
66
-
67
-
68
-
69
-
70
-
71
-
72
-
73
-
74
-
75
-
76
-
77
-
78
-
79
-
80
-
81
-
82
-
83
-
84
-
85
-
86
-
87
-
88
-
89
-
90
-
91
-
92
-
93
-
94
-
95
-
96
-
97
-
98
-
99
-
100
-
101
-
102
-
103
-
104
-
105
-
106
-
107
-
108
-
109
-
110
-
111
-
112
-
113
-
114
-
115
-
116
-
117
-
118
-
119
-
120
-
121
-
122
-
123
-
124
-
125
-
126
-
127
-
128
-
129
-
130
-
131
-
132
-
133
-
134
-
135
-
136
-
137
-
138
-
139
-
140
-
141
-
142
-
143
-
144
-
145
-
146
-
147
-
148
-
149
-
150
-
151
-
152
-
153
-
154
-
155
-
156
-
157
-
158
-
159
-
160
-
161
-
162
-
163
-
164
-
165
-
166
-
167
-
168
-
169
-
170
-
171
-
172
-
173
-
174
-
175
-
176
-
177
-
178
-
179
-
180
-
181
-
182
-
183
-
184
-
185
-
186
-
187
-
188
-
189
-
190
-
191
-
192
-
193
-
194
-
195
-
196
-
197
-
198
-
199
-
200
-
201
-
202
-
203
-
204
-
205
-
206
-
207
-
208
-
209
-
210
-
211
-
212
-
213
-
214
-
215
-
216
-
217
-
218
-
219
-
220
-
221
-
222
-
223
-
224
-
225
-
226
-
227
-
228
-
229
-
230
-
231
-
232
-
233
-
234
-
235
-
236
-
237
-
238
-
239
-
240
-
241
-
242
-
243
-
244
-
245
-
246
-
247
-
248
-
249
-
250
-
251
-
252
-
253
-
254
-
255
-
256
-
257
-
258
-
259
-
260
-
261
-
262
-
263
-
264
-
265
-
266
-
267
-
268
-
269
-
270
-
271
-
272
-
273
-
274
-
275
-
276
-
277
-
278
-
279
-
280
-
281
-
282
-
283
-
284
-
285
-
286
-
287
-
288
-
289
-
290
-
291
-
292
-
293
-
294
-
295
-
296
-
297
-
298
-
299
-
300
-
301
-
302
-
303
-
304
-
305
-
306
-
307
-
308
-
309
-
310
-
311
-
312
 |
 |

40
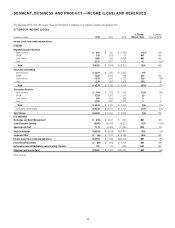
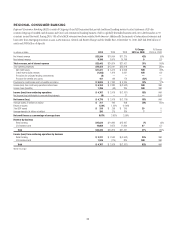
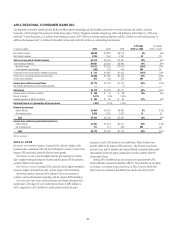
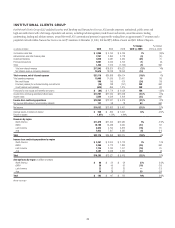
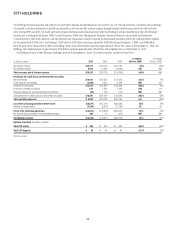
ASIA REGIONAL CONSUMER BANKING
Asia Regional Consumer Banking (Asia RCB) provides traditional banking and Citi-branded card services to retail customers and small to mid-size
businesses, with the largest Citi presence in South Korea, Japan, Taiwan, Singapore, Australia, Hong Kong, India and Indonesia. At December 31, 2010, Asia
RCB had 711 retail branches, 16.1 million retail banking accounts, $105.6 billion in average customer deposits, and $61.2 billion in retail banking loans. In
addition, the business had 15.1 million Citi-branded card accounts with $20.4 billion in outstanding loan balances.
In millions of dollars 2010 2009 2008
% Change
2010 vs. 2009
% Change
2009 vs. 2008
Net interest revenue $5,088 $4,822 $ 5,070 6% (5)%
Non-interest revenue 2,326 1,944 2,391 20 (19)
Total revenues, net of interest expense $7,414 $6,766 $7,461 10% (9)%
Total operating expenses $4,001 $3,522 $ 3,890 14% (9)%
Net credit losses $1,012 $1,339 $ 1,010 (24)% 33%
Credit reserve build (release) (285) 523 435 NM 20
Provisions for loan losses and for benefits and claims $ 727 $1,862 $1,445 (61)% 29%
Income from continuing operations before taxes $2,686 $1,382 $ 2,126 94% (35)%
Income taxes (benefits) 514 (50) 356 NM NM
Income from continuing operations $2,172 $1,432 $ 1,770 52% (19)%
Net income attributable to noncontrolling interests —— (1) ——
Net income $2,172 $1,432 $1,771 52% (19)%
Average assets (in billions of dollars) $ 108 $ 93 $ 98 16% (5)%
Return on assets 2.01% 1.54% 1.81%
Average deposits (in billions of dollars) $ 100 $ 89 $ 93 12% (4)%
Net credit losses as a percentage of average loans 1.36% 2.07% 1.40%
Revenue by business
Retail banking $4,604 $4,281 $ 4,847 8% (12)%
Citi-branded cards 2,810 2,485 2,614 13 (5)
Total $7,414 $6,766 $7,461 10% (9)%
Income from continuing operations by business
Retail banking $1,461 $1,218 $ 1,414 20% (14)%
Citi-branded cards 711 214 356 NM (40)
Total $2,172 $1,432 $1,770 52% (19)%
NM Not meaningful
2010 vs. 2009
Revenues, net of interest expense increased 10%, driven by higher cards
purchase sales, investment sales and loan and deposit volumes, as well as the
impact of FX translation, partially offset by lower spreads.
Net interest revenue was 6% higher than the prior-year period, mainly
due to higher lending and deposit volumes and the impact of FX translation,
partially offset by lower spreads.
Non-interest revenue increased 20%, primarily due to higher investment
revenues, higher cards purchase sales, and the impact of FX translation.
Operating expenses increased 14%, primarily due to an increase in
volumes, continued investment spending, and the impact of FX translation.
Provisions for loan losses and for benefits and claims decreased 61%,
mainly due to the impact of a net credit reserve release of $285 million in
2010, compared to a $523 million net credit reserve build in the prior-
year period, and a 24% decline in net credit losses. These declines were
partially offset by the impact of FX translation. The decrease in provision
for loan losses and for benefits and claims reflected continued credit quality
improvement across the region, particularly in India, partially offset by
increasing volumes.
During 2010, the effective tax rate in Japan was approximately 19%,
which reflected continued tax benefits (APB 23). These benefits are not likely
to continue, or continue at the same levels, in 2011, however, which will
likely lead to an increase in the effective tax rate for Asia RCB in 2011.