Citibank 2010 Annual Report Download - page 205
Download and view the complete annual report
Please find page 205 of the 2010 Citibank annual report below. You can navigate through the pages in the report by either clicking on the pages listed below, or by using the keyword search tool below to find specific information within the annual report.-
 1
1 -
2
-
3
-
4
-
5
-
6
-
7
-
8
-
9
-
10
-
11
-
12
-
13
-
14
-
15
-
16
-
17
-
18
-
19
-
20
-
21
-
22
-
23
-
24
-
25
-
26
-
27
-
28
-
29
-
30
-
31
-
32
-
33
-
34
-
35
-
36
-
37
-
38
-
39
-
40
-
41
-
42
-
43
-
44
-
45
-
46
-
47
-
48
-
49
-
50
-
51
-
52
-
53
-
54
-
55
-
56
-
57
-
58
-
59
-
60
-
61
-
62
-
63
-
64
-
65
-
66
-
67
-
68
-
69
-
70
-
71
-
72
-
73
-
74
-
75
-
76
-
77
-
78
-
79
-
80
-
81
-
82
-
83
-
84
-
85
-
86
-
87
-
88
-
89
-
90
-
91
-
92
-
93
-
94
-
95
-
96
-
97
-
98
-
99
-
100
-
101
-
102
-
103
-
104
-
105
-
106
-
107
-
108
-
109
-
110
-
111
-
112
-
113
-
114
-
115
-
116
-
117
-
118
-
119
-
120
-
121
-
122
-
123
-
124
-
125
-
126
-
127
-
128
-
129
-
130
-
131
-
132
-
133
-
134
-
135
-
136
-
137
-
138
-
139
-
140
-
141
-
142
-
143
-
144
-
145
-
146
-
147
-
148
-
149
-
150
-
151
-
152
-
153
-
154
-
155
-
156
-
157
-
158
-
159
-
160
-
161
-
162
-
163
-
164
-
165
-
166
-
167
-
168
-
169
-
170
-
171
-
172
-
173
-
174
-
175
-
176
-
177
-
178
-
179
-
180
-
181
-
182
-
183
-
184
-
185
-
186
-
187
-
188
-
189
-
190
-
191
-
192
-
193
-
194
-
 195
195 -
 196
196 -
 197
197 -
 198
198 -
 199
199 -
 200
200 -
 201
201 -
 202
202 -
 203
203 -
 204
204 -
 205
205 -
 206
206 -
 207
207 -
 208
208 -
 209
209 -
 210
210 -
 211
211 -
 212
212 -
 213
213 -
 214
214 -
 215
215 -
216
-
217
-
218
-
219
-
220
-
221
-
222
-
223
-
224
-
225
-
226
-
227
-
228
-
229
-
230
-
231
-
232
-
233
-
234
-
235
-
236
-
237
-
238
-
239
-
240
-
241
-
242
-
243
-
244
-
245
-
246
-
247
-
248
-
249
-
250
-
251
-
252
-
253
-
254
-
255
-
256
-
257
-
258
-
259
-
260
-
261
-
262
-
263
-
264
-
265
-
266
-
267
-
268
-
269
-
270
-
271
-
272
-
273
-
274
-
275
-
276
-
277
-
278
-
279
-
280
-
281
-
282
-
283
-
284
-
285
-
286
-
287
-
288
-
289
-
290
-
291
-
292
-
293
-
294
-
295
-
296
-
297
-
298
-
299
-
300
-
301
-
302
-
303
-
304
-
305
-
306
-
307
-
308
-
309
-
310
-
311
-
312
 |
 |

203
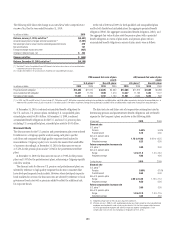
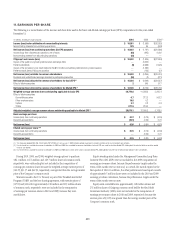
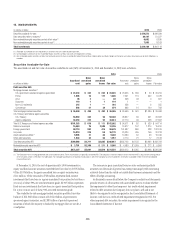
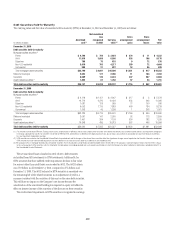
11. EARNINGS PER SHARE
The following is a reconciliation of the income and share data used in the basic and diluted earnings per share (EPS) computations for the years ended
December 31:
In millions, except per-share amounts 2010 2009 2008 (1)
Income (loss) before attribution of noncontrolling interests $ 10,951 $ (1,066) $(32,029)
Noncontrolling interests from continuing operations 329 95 (343)
Net income (loss) from continuing operations (for EPS purposes) $ 10,622 $ (1,161) $(31,686)
Income (loss) from discontinued operations, net of taxes (68) (445) 4,002
Noncontrolling interest from discontinuing operations (48) — —
Citigroup’s net income (loss) $ 10,602 $ (1,606) $(27,684)
Impact of the public and private preferred stock exchange offers — (3,242) —
Preferred dividends (9) (2,988) (1,695)
Impact of the conversion price reset related to the $12.5 billion convertible preferred stock private issuance — (1,285) —
Preferred stock Series H discount accretion — (123) (37)
Net income (loss) available to common shareholders $ 10,593 $ (9,244) $(29,416)
Dividends and undistributed earnings allocated to participating securities (90) (2) (221)
Net income (loss) allocated to common shareholders for basic EPS (2) $ 10,503 $ (9,246) $(29,637)
Effect of dilutive securities 2540 877
Net income (loss) allocated to common shareholders for diluted EPS (2) $ 10,505 $ (8,706) $(28,760)
Weighted-average common shares outstanding applicable to basic EPS 28,776.0 11,568.3 5,265.4
Effect of dilutive securities
Convertible securities 0.7 312.3 503.2
Other employee plans 19.8 0.2 —
Options 3.7 0.2 0.3
TDECs 877.9 218.3 —
Adjusted weighted-average common shares outstanding applicable to diluted EPS (3) 29,678.1 12,099.3 5,768.9
Basic earnings per share
Income (loss) from continuing operations $ 0.37 $ (0.76) $ (6.39)
Discontinued operations (0.01) (0.04) 0.76
Net income (loss) $ 0.36 $ (0.80) $ (5.63)
Diluted earnings per share (2)(3)
Income (loss) from continuing operations $ 0.35 $ (0.76) $ (6.39)
Discontinued operations — (0.04) 0.76
Net income (loss) $ 0.35 $ (0.80) $ (5.63)
(1) The Company adopted ASC 260-10-45 to 65 (FSP EITF 03-6-1) on January 1, 2009. All prior periods have been restated to conform to the current period’s presentation.
(2) Due to the net loss available to common shareholders in 2009 and 2008, loss available to common stockholders for basic EPS was used to calculate diluted EPS. Adding back the effect of dilutive securities would
result in anti-dilution.
(3) Due to the net loss available to common shareholders in 2009 and 2008, basic shares were used to calculate diluted EPS. Adding dilutive securities to the denominator would result in anti-dilution.
During 2010, 2009, and 2008, weighted-average options to purchase
386.1 million, 165.6 million and 169.7 million shares of common stock,
respectively, were outstanding but not included in the computation of
earnings per common share, because the weighted-average exercise prices of
$10.29, $31.57 and $41.92, respectively, were greater than the average market
price of the Company’s common stock.
Warrants issued to the U.S. Treasury as part of the Troubled Asset Relief
Program (TARP) and the loss-sharing agreement, with exercise prices of
$17.85 and $10.61 for approximately 210 million and 255 million shares
of common stock, respectively, were not included in the computation
of earnings per common share in 2010 and 2009, because they were
anti-dilutive.
Equity awards granted under the Management Committee Long-Term
Incentive Plan (MC LTIP) were not included in the 2009 computation of
earnings per common share, because the performance targets under the
terms of the awards were not met and, as a result, the awards expired in the
first quarter of 2010. In addition, the other performance-based equity awards
of approximately 5 million shares were not included in the 2010 and 2009
earnings per share calculation, because the performance targets under the
terms of the awards were not met.
Equity units convertible into approximately 118 million shares and
235 million shares of Citigroup common stock held by the Abu Dhabi
Investment Authority (ADIA) were not included in the computation of
earnings per common share in 2010 and 2009, respectively, because the
exercise price of $31.83 was greater than the average market price of the
Company’s common stock.