Citibank 2010 Annual Report Download - page 207
Download and view the complete annual report
Please find page 207 of the 2010 Citibank annual report below. You can navigate through the pages in the report by either clicking on the pages listed below, or by using the keyword search tool below to find specific information within the annual report.-
 1
1 -
2
-
3
-
4
-
5
-
6
-
7
-
8
-
9
-
10
-
11
-
12
-
13
-
14
-
15
-
16
-
17
-
18
-
19
-
20
-
21
-
22
-
23
-
24
-
25
-
26
-
27
-
28
-
29
-
30
-
31
-
32
-
33
-
34
-
35
-
36
-
37
-
38
-
39
-
40
-
41
-
42
-
43
-
44
-
45
-
46
-
47
-
48
-
49
-
50
-
51
-
52
-
53
-
54
-
55
-
56
-
57
-
58
-
59
-
60
-
61
-
62
-
63
-
64
-
65
-
66
-
67
-
68
-
69
-
70
-
71
-
72
-
73
-
74
-
75
-
76
-
77
-
78
-
79
-
80
-
81
-
82
-
83
-
84
-
85
-
86
-
87
-
88
-
89
-
90
-
91
-
92
-
93
-
94
-
95
-
96
-
97
-
98
-
99
-
100
-
101
-
102
-
103
-
104
-
105
-
106
-
107
-
108
-
109
-
110
-
111
-
112
-
113
-
114
-
115
-
116
-
117
-
118
-
119
-
120
-
121
-
122
-
123
-
124
-
125
-
126
-
127
-
128
-
129
-
130
-
131
-
132
-
133
-
134
-
135
-
136
-
137
-
138
-
139
-
140
-
141
-
142
-
143
-
144
-
145
-
146
-
147
-
148
-
149
-
150
-
151
-
152
-
153
-
154
-
155
-
156
-
157
-
158
-
159
-
160
-
161
-
162
-
163
-
164
-
165
-
166
-
167
-
168
-
169
-
170
-
171
-
172
-
173
-
174
-
175
-
176
-
177
-
178
-
179
-
180
-
181
-
182
-
183
-
184
-
185
-
186
-
187
-
188
-
189
-
190
-
191
-
192
-
193
-
194
-
195
-
196
-
 197
197 -
 198
198 -
 199
199 -
 200
200 -
 201
201 -
 202
202 -
 203
203 -
 204
204 -
 205
205 -
 206
206 -
 207
207 -
 208
208 -
 209
209 -
 210
210 -
 211
211 -
 212
212 -
 213
213 -
 214
214 -
 215
215 -
 216
216 -
 217
217 -
218
-
219
-
220
-
221
-
222
-
223
-
224
-
225
-
226
-
227
-
228
-
229
-
230
-
231
-
232
-
233
-
234
-
235
-
236
-
237
-
238
-
239
-
240
-
241
-
242
-
243
-
244
-
245
-
246
-
247
-
248
-
249
-
250
-
251
-
252
-
253
-
254
-
255
-
256
-
257
-
258
-
259
-
260
-
261
-
262
-
263
-
264
-
265
-
266
-
267
-
268
-
269
-
270
-
271
-
272
-
273
-
274
-
275
-
276
-
277
-
278
-
279
-
280
-
281
-
282
-
283
-
284
-
285
-
286
-
287
-
288
-
289
-
290
-
291
-
292
-
293
-
294
-
295
-
296
-
297
-
298
-
299
-
300
-
301
-
302
-
303
-
304
-
305
-
306
-
307
-
308
-
309
-
310
-
311
-
312
 |
 |

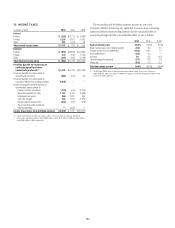
205
13. BROKERAGE RECEIVABLES AND BROKERAGE
PAYABLES
The Company has receivables and payables for financial instruments
purchased from and sold to brokers, dealers and customers. The Company is
exposed to risk of loss from the inability of brokers, dealers or customers to
pay for purchases or to deliver the financial instruments sold, in which case
the Company would have to sell or purchase the financial instruments at
prevailing market prices. Credit risk is reduced to the extent that an exchange
or clearing organization acts as a counterparty to the transaction.
The Company seeks to protect itself from the risks associated with
customer activities by requiring customers to maintain margin collateral
in compliance with regulatory and internal guidelines. Margin levels are
monitored daily, and customers deposit additional collateral as required.
Where customers cannot meet collateral requirements, the Company will
liquidate sufficient underlying financial instruments to bring the customer
into compliance with the required margin level.
Exposure to credit risk is impacted by market volatility, which may impair
the ability of clients to satisfy their obligations to the Company. Credit limits
are established and closely monitored for customers and brokers and dealers
engaged in forwards, futures and other transactions deemed to be credit
sensitive.
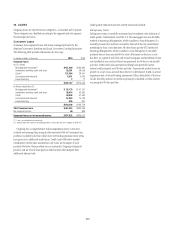
Brokerage receivables and brokerage payables, which arise in the normal
course of business, consisted of the following at December 31:
In millions of dollars 2010 2009
Receivables from customers $21,952 $24,721
Receivables from brokers, dealers, and clearing organizations 9,261 8,913
Total brokerage receivables $31,213 $33,634
Payables to customers $36,142 $41,262
Payables to brokers, dealers, and clearing organizations 15,607 19,584
Total brokerage payables $51,749 $60,846
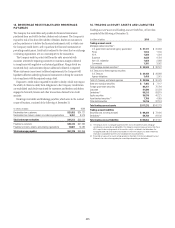
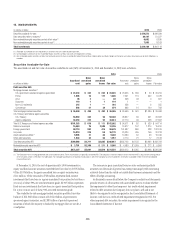
14. TRADING ACCOUNT ASSETS AND LIABILITIES
Trading account assets and Trading account liabilities, at fair value,
consisted of the following at December 31:
In millions of dollars 2010 2009
Trading account assets
Mortgage-backed securities (1)
U.S. government-sponsored agency guaranteed $ 27,127 $ 20,638
Prime 1,514 1,156
Alt-A 1,502 1,229
Subprime 2,036 9,734
Non-U.S. residential 1,052 2,368
Commercial 1,301 3,062
Total mortgage-backed securities (1) $ 34,532 $ 38,187
U.S. Treasury and federal agency securities
U.S. Treasury $ 20,168 $ 28,938
Agency obligations 3,418 2,041
Total U.S. Treasury and federal agencies $ 23,586 $ 30,979
State and municipal securities $ 7,493 $ 7,147
Foreign government securities 88,311 72,769
Corporate 51,586 52,378
Derivatives (2) 50,213 58,879
Equity securities 38,576 46,221
Asset-backed securities (1) 7,759 4,089
Other debt securities 15,216 32,124
Total trading account assets $317,272 $342,773
Trading account liabilities
Securities sold, not yet purchased $ 69,324 $ 73,406
Derivatives (2) 59,730 64,106
Total trading account liabilities $129,054 $137,512
(1) The Company invests in mortgage-backed securities and asset-backed securities. Mortgage
securitizations are generally considered VIEs. The Company’s maximum exposure to loss from these
VIEs is equal to the carrying amount of the securities, which is reflected in the table above. For
mortgage-backed and asset-backed securitizations in which the Company has other involvement,
information is provided in Note 22 to the Consolidated Financial Statements.
(2) Presented net, pursuant to master netting agreements. See Note 23 to the Consolidated Financial
Statements for a discussion regarding the accounting and reporting for derivatives.