Citibank 2010 Annual Report Download - page 306
Download and view the complete annual report
Please find page 306 of the 2010 Citibank annual report below. You can navigate through the pages in the report by either clicking on the pages listed below, or by using the keyword search tool below to find specific information within the annual report.-
 1
1 -
2
-
3
-
4
-
5
-
6
-
7
-
8
-
9
-
10
-
11
-
12
-
13
-
14
-
15
-
16
-
17
-
18
-
19
-
20
-
21
-
22
-
23
-
24
-
25
-
26
-
27
-
28
-
29
-
30
-
31
-
32
-
33
-
34
-
35
-
36
-
37
-
38
-
39
-
40
-
41
-
42
-
43
-
44
-
45
-
46
-
47
-
48
-
49
-
50
-
51
-
52
-
53
-
54
-
55
-
56
-
57
-
58
-
59
-
60
-
61
-
62
-
63
-
64
-
65
-
66
-
67
-
68
-
69
-
70
-
71
-
72
-
73
-
74
-
75
-
76
-
77
-
78
-
79
-
80
-
81
-
82
-
83
-
84
-
85
-
86
-
87
-
88
-
89
-
90
-
91
-
92
-
93
-
94
-
95
-
96
-
97
-
98
-
99
-
100
-
101
-
102
-
103
-
104
-
105
-
106
-
107
-
108
-
109
-
110
-
111
-
112
-
113
-
114
-
115
-
116
-
117
-
118
-
119
-
120
-
121
-
122
-
123
-
124
-
125
-
126
-
127
-
128
-
129
-
130
-
131
-
132
-
133
-
134
-
135
-
136
-
137
-
138
-
139
-
140
-
141
-
142
-
143
-
144
-
145
-
146
-
147
-
148
-
149
-
150
-
151
-
152
-
153
-
154
-
155
-
156
-
157
-
158
-
159
-
160
-
161
-
162
-
163
-
164
-
165
-
166
-
167
-
168
-
169
-
170
-
171
-
172
-
173
-
174
-
175
-
176
-
177
-
178
-
179
-
180
-
181
-
182
-
183
-
184
-
185
-
186
-
187
-
188
-
189
-
190
-
191
-
192
-
193
-
194
-
195
-
196
-
197
-
198
-
199
-
200
-
201
-
202
-
203
-
204
-
205
-
206
-
207
-
208
-
209
-
210
-
211
-
212
-
213
-
214
-
215
-
216
-
217
-
218
-
219
-
220
-
221
-
222
-
223
-
224
-
225
-
226
-
227
-
228
-
229
-
230
-
231
-
232
-
233
-
234
-
235
-
236
-
237
-
238
-
239
-
240
-
241
-
242
-
243
-
244
-
245
-
246
-
247
-
248
-
249
-
250
-
251
-
252
-
253
-
254
-
255
-
256
-
257
-
258
-
259
-
260
-
261
-
262
-
263
-
264
-
265
-
266
-
267
-
268
-
269
-
270
-
271
-
272
-
273
-
274
-
275
-
276
-
277
-
278
-
279
-
280
-
281
-
282
-
283
-
284
-
285
-
286
-
287
-
288
-
289
-
290
-
291
-
292
-
293
-
294
-
295
-
 296
296 -
 297
297 -
 298
298 -
 299
299 -
 300
300 -
 301
301 -
 302
302 -
 303
303 -
 304
304 -
 305
305 -
 306
306 -
 307
307 -
 308
308 -
 309
309 -
 310
310 -
 311
311 -
 312
312
 |
 |
304
Dividends
For a summary of the cash dividends paid on Citi’s outstanding common
stock during 2009 and 2010, see Note 33 to the Consolidated Financial
Statements. For so long as the U.S. government holds any Citigroup trust
preferred securities acquired pursuant to the exchange offers consummated
in 2009, Citigroup has agreed not to pay a quarterly common stock dividend
exceeding $0.01 per quarter, subject to certain customary exceptions.
Further, any dividend on Citi’s outstanding common stock would need to be
made in compliance with Citi’s obligations to any remaining outstanding
Citigroup preferred stock.
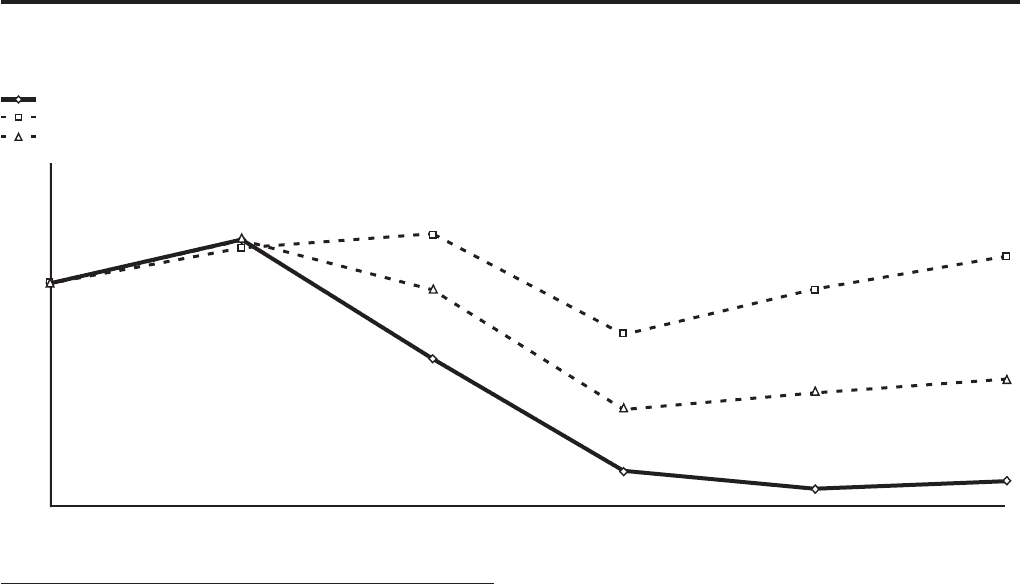
PERFORMANCE GRAPH
Comparison of Five-Year Cumulative Total Return
The following graph and table compare the cumulative total return on
Citigroup’s common stock with the cumulative total return of the S&P 500
Index and the S&P Financial Index over the five-year period extending
through December 31, 2010. The graph and table assume that $100 was
invested on December 31, 2005 in Citigroup’s common stock, the S&P 500
Index and the S&P Financial Index and that all dividends were reinvested.
$0
$25
$50
$75
$100
$125
$150
Citigroup
S&P 500 Index
S&P Financial Index
Comparison of Five-Year Cumulative Total Return
For the years ended
2006 2007 2008 2009 2010
DECEMBER 31, CITIGROUP S&P 500 INDEX S&P FINANCIAL INDEX
2006 119.55 115.79 119.19
2007 66.10 122.15 96.98
2008 15.88 76.96 43.34
2009 7.85 97.33 50.80
2010 11.22 111.99 56.96