Citibank 2010 Annual Report Download - page 131
Download and view the complete annual report
Please find page 131 of the 2010 Citibank annual report below. You can navigate through the pages in the report by either clicking on the pages listed below, or by using the keyword search tool below to find specific information within the annual report.-
 1
1 -
2
-
3
-
4
-
5
-
6
-
7
-
8
-
9
-
10
-
11
-
12
-
13
-
14
-
15
-
16
-
17
-
18
-
19
-
20
-
21
-
22
-
23
-
24
-
25
-
26
-
27
-
28
-
29
-
30
-
31
-
32
-
33
-
34
-
35
-
36
-
37
-
38
-
39
-
40
-
41
-
42
-
43
-
44
-
45
-
46
-
47
-
48
-
49
-
50
-
51
-
52
-
53
-
54
-
55
-
56
-
57
-
58
-
59
-
60
-
61
-
62
-
63
-
64
-
65
-
66
-
67
-
68
-
69
-
70
-
71
-
72
-
73
-
74
-
75
-
76
-
77
-
78
-
79
-
80
-
81
-
82
-
83
-
84
-
85
-
86
-
87
-
88
-
89
-
90
-
91
-
92
-
93
-
94
-
95
-
96
-
97
-
98
-
99
-
100
-
101
-
102
-
103
-
104
-
105
-
106
-
107
-
108
-
109
-
110
-
111
-
112
-
113
-
114
-
115
-
116
-
117
-
118
-
119
-
120
-
 121
121 -
 122
122 -
 123
123 -
 124
124 -
 125
125 -
 126
126 -
 127
127 -
 128
128 -
 129
129 -
 130
130 -
 131
131 -
 132
132 -
 133
133 -
 134
134 -
 135
135 -
 136
136 -
 137
137 -
 138
138 -
 139
139 -
 140
140 -
 141
141 -
142
-
143
-
144
-
145
-
146
-
147
-
148
-
149
-
150
-
151
-
152
-
153
-
154
-
155
-
156
-
157
-
158
-
159
-
160
-
161
-
162
-
163
-
164
-
165
-
166
-
167
-
168
-
169
-
170
-
171
-
172
-
173
-
174
-
175
-
176
-
177
-
178
-
179
-
180
-
181
-
182
-
183
-
184
-
185
-
186
-
187
-
188
-
189
-
190
-
191
-
192
-
193
-
194
-
195
-
196
-
197
-
198
-
199
-
200
-
201
-
202
-
203
-
204
-
205
-
206
-
207
-
208
-
209
-
210
-
211
-
212
-
213
-
214
-
215
-
216
-
217
-
218
-
219
-
220
-
221
-
222
-
223
-
224
-
225
-
226
-
227
-
228
-
229
-
230
-
231
-
232
-
233
-
234
-
235
-
236
-
237
-
238
-
239
-
240
-
241
-
242
-
243
-
244
-
245
-
246
-
247
-
248
-
249
-
250
-
251
-
252
-
253
-
254
-
255
-
256
-
257
-
258
-
259
-
260
-
261
-
262
-
263
-
264
-
265
-
266
-
267
-
268
-
269
-
270
-
271
-
272
-
273
-
274
-
275
-
276
-
277
-
278
-
279
-
280
-
281
-
282
-
283
-
284
-
285
-
286
-
287
-
288
-
289
-
290
-
291
-
292
-
293
-
294
-
295
-
296
-
297
-
298
-
299
-
300
-
301
-
302
-
303
-
304
-
305
-
306
-
307
-
308
-
309
-
310
-
311
-
312
 |
 |

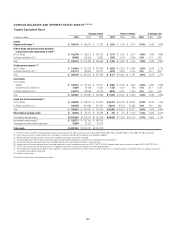
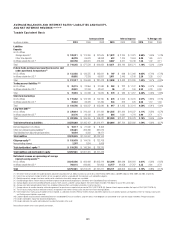
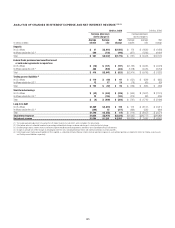
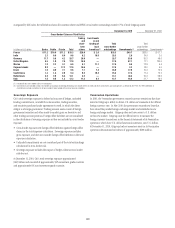
129
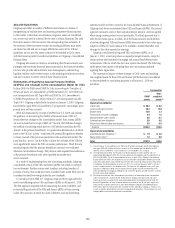
As required by SEC rules, the table below shows all countries where total FFIEC cross-border outstandings exceed 0.75% of total Citigroup assets:
December 31, 2010 December 31, 2009
Cross-Border Claims on Third Parties
In billions of U.S. dollars Banks Public Private Total
Trading
and
short-
term
claims
Investments
in and
funding of
local
franchises (1)
Total
cross-border
outstandings Commitments (2)
Total
cross-border
outstandings Commitments (2)
France $11.2 $10.9 $11.2 $33.3 $25.9 $ 2.0 $35.3 $49.7 $33.0 $ 61.7
India 2.3 0.6 6.9 9.8 8.2 18.5 28.3 2.6 24.9 2.0
Germany 11.7 9.8 4.2 25.7 20.9 — 25.7 39.8 30.2 48.6
United Kingdom 9.5 1.0 7.4 17.9 15.9 — 17.9 97.1 17.1 130.0
Mexico 1.2 2.2 3.1 6.5 4.1 11.1 17.6 9.5 12.8 9.4
Cayman Islands 0.2 — 17.3 17.5 16.6 — 17.5 3.2 18.0 6.6
Brazil 1.5 0.9 7.1 9.5 7.1 7.4 16.9 17.5 10.3 13.9
South Korea 1.3 1.6 2.5 5.4 5.2 10.4 15.8 17.6 17.4 15.2
Netherlands 4.2 2.5 6.4 13.1 8.2 — 13.1 44.3 20.3 58.6
Italy 1.5 9.5 1.3 12.3 11.2 0.4 12.7 18.4 21.7 18.9
(1) Included in total cross-border claims on third parties.
(2) Commitments (not included in total cross-border outstandings) include legally binding cross-border letters of credit and other commitments and contingencies as defined by the FFIEC. The FFIEC definition of
commitments includes commitments to local residents to be funded with local currency local liabilities.
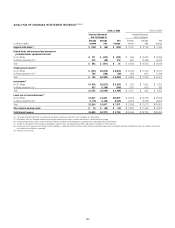
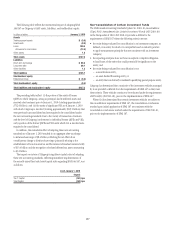
Sovereign Exposure
Citi’s total sovereign exposure is defined as loans net of hedges, unfunded
lending commitments, available for sale securities, trading securities,
and securities purchased under agreements to resell, in which the direct
obligor is a foreign government. Trading account assets consist of foreign
government securities and other mark-to-market gains on derivative and
other trading account positions. Foreign office liabilities are not considered
in the calculation of sovereign exposure as they are included in cross-border
exposure.
Cross-border exposure nets foreign office liabilities against foreign office •
claims in the total exposure calculation. Sovereign exposure includes
gross exposure, and does not consider foreign office liabilities in the total
exposure calculation.
Unfunded commitments are not considered part of the total outstandings •
calculation for cross-border risk.
Sovereign exposure includes the impact of hedges, whereas cross-border •
risk does not.
At December 31, 2010, Citi’s total sovereign exposure approximated
$265 billion and consisted of approximately 94% investment grade countries
and approximately 6% non-investment grade countries.
Venezuelan Operations
In 2003, the Venezuelan government enacted currency restrictions that have
restricted Citigroup’s ability to obtain U.S. dollars in Venezuela at the official
foreign currency rate. In May 2010, the government enacted new laws that
have closed the parallel foreign exchange market and established a new
foreign exchange market. Citigroup does not have access to U.S. dollars
in this new market. Citigroup uses the official rate to re-measure the
foreign currency transactions in the financial statements of its Venezuelan
operations, which have U.S. dollar functional currencies, into U.S. dollars.
At December 31, 2010, Citigroup had net monetary assets in its Venezuelan
operations denominated in bolivars of approximately $200 million.