Citibank 2010 Annual Report Download - page 267
Download and view the complete annual report
Please find page 267 of the 2010 Citibank annual report below. You can navigate through the pages in the report by either clicking on the pages listed below, or by using the keyword search tool below to find specific information within the annual report.-
 1
1 -
2
-
3
-
4
-
5
-
6
-
7
-
8
-
9
-
10
-
11
-
12
-
13
-
14
-
15
-
16
-
17
-
18
-
19
-
20
-
21
-
22
-
23
-
24
-
25
-
26
-
27
-
28
-
29
-
30
-
31
-
32
-
33
-
34
-
35
-
36
-
37
-
38
-
39
-
40
-
41
-
42
-
43
-
44
-
45
-
46
-
47
-
48
-
49
-
50
-
51
-
52
-
53
-
54
-
55
-
56
-
57
-
58
-
59
-
60
-
61
-
62
-
63
-
64
-
65
-
66
-
67
-
68
-
69
-
70
-
71
-
72
-
73
-
74
-
75
-
76
-
77
-
78
-
79
-
80
-
81
-
82
-
83
-
84
-
85
-
86
-
87
-
88
-
89
-
90
-
91
-
92
-
93
-
94
-
95
-
96
-
97
-
98
-
99
-
100
-
101
-
102
-
103
-
104
-
105
-
106
-
107
-
108
-
109
-
110
-
111
-
112
-
113
-
114
-
115
-
116
-
117
-
118
-
119
-
120
-
121
-
122
-
123
-
124
-
125
-
126
-
127
-
128
-
129
-
130
-
131
-
132
-
133
-
134
-
135
-
136
-
137
-
138
-
139
-
140
-
141
-
142
-
143
-
144
-
145
-
146
-
147
-
148
-
149
-
150
-
151
-
152
-
153
-
154
-
155
-
156
-
157
-
158
-
159
-
160
-
161
-
162
-
163
-
164
-
165
-
166
-
167
-
168
-
169
-
170
-
171
-
172
-
173
-
174
-
175
-
176
-
177
-
178
-
179
-
180
-
181
-
182
-
183
-
184
-
185
-
186
-
187
-
188
-
189
-
190
-
191
-
192
-
193
-
194
-
195
-
196
-
197
-
198
-
199
-
200
-
201
-
202
-
203
-
204
-
205
-
206
-
207
-
208
-
209
-
210
-
211
-
212
-
213
-
214
-
215
-
216
-
217
-
218
-
219
-
220
-
221
-
222
-
223
-
224
-
225
-
226
-
227
-
228
-
229
-
230
-
231
-
232
-
233
-
234
-
235
-
236
-
237
-
238
-
239
-
240
-
241
-
242
-
243
-
244
-
245
-
246
-
247
-
248
-
249
-
250
-
251
-
252
-
253
-
254
-
255
-
256
-
 257
257 -
 258
258 -
 259
259 -
 260
260 -
 261
261 -
 262
262 -
 263
263 -
 264
264 -
 265
265 -
 266
266 -
 267
267 -
 268
268 -
 269
269 -
 270
270 -
 271
271 -
 272
272 -
 273
273 -
 274
274 -
 275
275 -
 276
276 -
 277
277 -
278
-
279
-
280
-
281
-
282
-
283
-
284
-
285
-
286
-
287
-
288
-
289
-
290
-
291
-
292
-
293
-
294
-
295
-
296
-
297
-
298
-
299
-
300
-
301
-
302
-
303
-
304
-
305
-
306
-
307
-
308
-
309
-
310
-
311
-
312
 |
 |

265
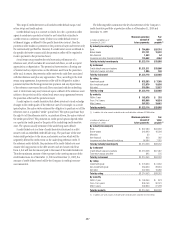
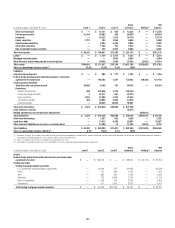
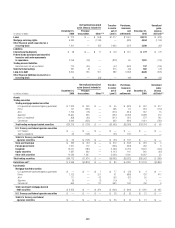
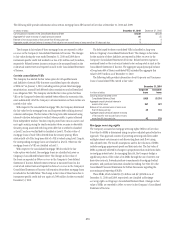
In millions of dollars at December 31, 2010 Level 1 Level 2 Level 3
Gross
inventory Netting (1)
Net
balance
State and municipal $ — $ 12,731 $ 504 $ 13,235 $ — $ 13,235
Foreign government 51,419 47,902 358 99,679 — 99,679
Corporate — 15,152 1,018 16,170 — 16,170
Equity securities 3,721 184 2,055 5,960 — 5,960
Asset-backed securities — 3,624 5,424 9,048 — 9,048
Other debt securities — 1,185 727 1,912 — 1,912
Non-marketable equity securities — 135 6,467 6,602 — 6,602
Total investments $ 69,241 $ 194,647 $17,286 $ 281,174 $ — $281,174
Loans (2) $ — $ 1,159 $ 3,213 $ 4,372 $ — $ 4,372
Mortgage servicing rights — — 4,554 4,554 — 4,554
Other financial assets measured on a recurring basis — 19,425 2,509 21,934 (2,615) 19,319
Total assets $188,992 $1,111,027 $70,784 $1,421,105 $(706,902) $714,203
Total as a percentage of gross assets (3) 13.8% 81.0% 5.2% 100%
Liabilities
Interest-bearing deposits $ — $ 988 $ 277 $ 1,265 $ — $ 1,265
Federal funds purchased and securities loaned or sold under
agreements to repurchase — 169,162 1,261 170,423 (49,230) 121,193
Trading account liabilities
Securities sold, not yet purchased 59,968 9,169 187 69,324 — 69,324
Derivatives
Interest rate contracts 489 472,936 3,314 476,739
Foreign exchange contracts 2 87,411 861 88,274
Equity contracts 2,551 27,486 3,397 33,434
Commodity contracts 482 10,968 2,068 13,518
Credit derivatives — 48,535 10,926 59,461
Total gross derivatives $ 3,524 $ 647,336 $20,566 $ 671,426
Cash collateral received 38,319
Netting agreements and market value adjustments (650,015)
Total derivatives $ 3,524 $ 647,336 $20,566 $ 709,745 $(650,015) $ 59,730
Short-term borrowings — 1,627 802 2,429 — 2,429
Long-term debt — 17,612 8,385 25,997 — 25,997
Other financial liabilities measured on a recurring basis — 12,306 19 12,325 (2,615) 9,710
Total liabilities $ 63,492 $ 858,200 $31,497 $ 991,508 $(701,860) $289,648
Total as a percentage of gross liabilities (3) 6.7% 90.0% 3.3% 100%
(1) Represents netting of: (i) the amounts due under securities purchased under agreements to resell and the amounts owed under securities sold under agreements to repurchase, and (ii) derivative exposures covered by
a qualifying master netting agreement, cash collateral, and the market value adjustment.
(2) There is no allowance for loan losses recorded for loans reported at fair value.
(3) Percentage is calculated based on total assets and liabilities at fair value, excluding collateral paid/received on derivatives.
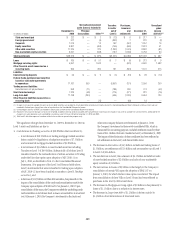
In millions of dollars at December 31, 2009 Level 1 Level 2 Level 3
Gross
inventory Netting (1)
Net
balance
Assets
Federal funds sold and securities borrowed or purchased under
agreements to resell $ — $ 138,525 $ — $ 138,525 $ (50,713) $ 87,812
Trading securities
Trading mortgage-backed securities
U.S. government-sponsored agency guaranteed — 19,666 972 20,638 — 20,638
Prime — 772 384 1,156 — 1,156
Alt-A — 842 387 1,229 — 1,229
Subprime — 736 8,998 9,734 — 9,734
Non-U.S. residential — 1,796 572 2,368 — 2,368
Commercial — 611 2,451 3,062 — 3,062
Total trading mortgage-backed securities $ — $ 24,423 $13,764 $ 38,187 $ — $ 38,187