Citibank 2010 Annual Report Download - page 183
Download and view the complete annual report
Please find page 183 of the 2010 Citibank annual report below. You can navigate through the pages in the report by either clicking on the pages listed below, or by using the keyword search tool below to find specific information within the annual report.-
 1
1 -
2
-
3
-
4
-
5
-
6
-
7
-
8
-
9
-
10
-
11
-
12
-
13
-
14
-
15
-
16
-
17
-
18
-
19
-
20
-
21
-
22
-
23
-
24
-
25
-
26
-
27
-
28
-
29
-
30
-
31
-
32
-
33
-
34
-
35
-
36
-
37
-
38
-
39
-
40
-
41
-
42
-
43
-
44
-
45
-
46
-
47
-
48
-
49
-
50
-
51
-
52
-
53
-
54
-
55
-
56
-
57
-
58
-
59
-
60
-
61
-
62
-
63
-
64
-
65
-
66
-
67
-
68
-
69
-
70
-
71
-
72
-
73
-
74
-
75
-
76
-
77
-
78
-
79
-
80
-
81
-
82
-
83
-
84
-
85
-
86
-
87
-
88
-
89
-
90
-
91
-
92
-
93
-
94
-
95
-
96
-
97
-
98
-
99
-
100
-
101
-
102
-
103
-
104
-
105
-
106
-
107
-
108
-
109
-
110
-
111
-
112
-
113
-
114
-
115
-
116
-
117
-
118
-
119
-
120
-
121
-
122
-
123
-
124
-
125
-
126
-
127
-
128
-
129
-
130
-
131
-
132
-
133
-
134
-
135
-
136
-
137
-
138
-
139
-
140
-
141
-
142
-
143
-
144
-
145
-
146
-
147
-
148
-
149
-
150
-
151
-
152
-
153
-
154
-
155
-
156
-
157
-
158
-
159
-
160
-
161
-
162
-
163
-
164
-
165
-
166
-
167
-
168
-
169
-
170
-
171
-
172
-
 173
173 -
 174
174 -
 175
175 -
 176
176 -
 177
177 -
 178
178 -
 179
179 -
 180
180 -
 181
181 -
 182
182 -
 183
183 -
 184
184 -
 185
185 -
 186
186 -
 187
187 -
 188
188 -
 189
189 -
 190
190 -
 191
191 -
 192
192 -
 193
193 -
194
-
195
-
196
-
197
-
198
-
199
-
200
-
201
-
202
-
203
-
204
-
205
-
206
-
207
-
208
-
209
-
210
-
211
-
212
-
213
-
214
-
215
-
216
-
217
-
218
-
219
-
220
-
221
-
222
-
223
-
224
-
225
-
226
-
227
-
228
-
229
-
230
-
231
-
232
-
233
-
234
-
235
-
236
-
237
-
238
-
239
-
240
-
241
-
242
-
243
-
244
-
245
-
246
-
247
-
248
-
249
-
250
-
251
-
252
-
253
-
254
-
255
-
256
-
257
-
258
-
259
-
260
-
261
-
262
-
263
-
264
-
265
-
266
-
267
-
268
-
269
-
270
-
271
-
272
-
273
-
274
-
275
-
276
-
277
-
278
-
279
-
280
-
281
-
282
-
283
-
284
-
285
-
286
-
287
-
288
-
289
-
290
-
291
-
292
-
293
-
294
-
295
-
296
-
297
-
298
-
299
-
300
-
301
-
302
-
303
-
304
-
305
-
306
-
307
-
308
-
309
-
310
-
311
-
312
 |
 |

181
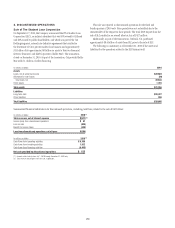
CitiCapital
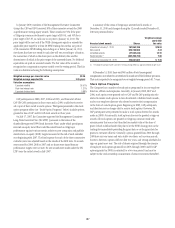
On July 31, 2008, Citigroup sold substantially all of CitiCapital, the
equipment finance unit in North America. The total proceeds from the
transaction were approximately $12.5 billion and resulted in an after-tax
loss to Citigroup of $305 million. This loss is included in Income from
discontinued operations on the Company’s Consolidated Statement
of Income for the second quarter of 2008. The assets and liabilities for
CitiCapital totaled approximately $12.9 billion and $0.5 billion, respectively,
at June 30, 2008.
This transaction encompassed seven CitiCapital equipment finance
business lines, including Healthcare Finance, Private Label Equipment
Finance, Material Handling Finance, Franchise Finance, Construction
Equipment Finance, Bankers Leasing, and CitiCapital Canada. CitiCapital’s
Tax Exempt Finance business was not part of the transaction and was
retained by Citigroup.
CitiCapital had approximately 1,400 employees and 160,000 customers
throughout North America.
Results for all of the CitiCapital businesses sold, as well as the net loss
recognized in 2008 from this sale, are reported as Discontinued operations
for all periods presented.
Summarized financial information for Discontinued operations,
including cash flows, related to the sale of CitiCapital is as follows:
In millions of dollars 2010 2009 2008
Total revenues, net of interest
expense (1) $ 6 $ 46 $ 24
Income (loss) from discontinued operations $ (3) $ (8) $ 40
Gain (loss) on sale —17 (506)
Provision (benefit) for income taxes (1) 4 (202)
Income (loss) from discontinued
operations, net of taxes $ (2) $ 5 $(264)
In millions of dollars 2010 2009 2008
Cash flows from operating activities $— $— $(287)
Cash flows from investing activities —— 349
Cash flows from financing activities —— (61)
Net cash provided by
discontinued operations $— $— $ 1
(1) Total revenues include gain or loss on sale, if applicable.
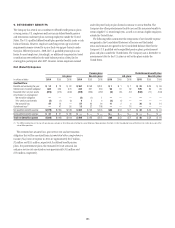
Combined Results for Discontinued Operations
The following is summarized financial information for the SLC
business, Nikko Cordial business, German retail banking operations and
CitiCapital business.
In addition to the businesses noted above, the following affected
Discontinued operations. During 2010, certain tax reserves were released,
in relation to the sale of Citigroup’s Life Insurance and Annuity business in
2005, due to favorable resolutions with the IRS. This resulted in an after-
tax gain of $59 million in 2010. During 2009, contingent consideration
payments of $29 million pretax ($19 million after tax) were received related
to the sale of Citigroup’s Asset Management business, which was sold in
December 2005. During 2008, in relation to the sale of its Life Insurance and
Annuity business in 2005, the Company fulfilled its previously agreed upon
obligations with regard to its remaining 10% economic interest in the long-
term care business that it had sold to the predecessor of Genworth Financial
in 2000. The reimbursement resulted in a pretax loss of $50 million
($33 million after tax) at December 31, 2008. The Asset Management and the
Life Insurance and Annuity transactions are included in these balances.
In millions of dollars 2010 2009 2008
Total revenues, net of interest
expense (1) $ (410) $ 779 $ 7,810
Income (loss) from discontinued operations $ 72 $ (653) $ 784
Gain (loss) on sale (702) 102 3,139
Benefit for income taxes (562) (106) (79)
Income (loss) from discontinued
operations, net of taxes $ (68) $ (445) $ 4,002
In millions of dollars 2010 2009 2008
Cash flows from operating activities $ 4,974 $(1,825) $ (5,681)
Cash flows from investing activities 1,726 1,854 19,664
Cash flows from financing activities (6,486) (6) (14,287)
Net cash provided by (used in)
discontinued operations $ 214 $ 23 $ (304)
(1) Total revenues include gain or loss on sale, if applicable.