Citibank 2010 Annual Report Download - page 214
Download and view the complete annual report
Please find page 214 of the 2010 Citibank annual report below. You can navigate through the pages in the report by either clicking on the pages listed below, or by using the keyword search tool below to find specific information within the annual report.-
 1
1 -
2
-
3
-
4
-
5
-
6
-
7
-
8
-
9
-
10
-
11
-
12
-
13
-
14
-
15
-
16
-
17
-
18
-
19
-
20
-
21
-
22
-
23
-
24
-
25
-
26
-
27
-
28
-
29
-
30
-
31
-
32
-
33
-
34
-
35
-
36
-
37
-
38
-
39
-
40
-
41
-
42
-
43
-
44
-
45
-
46
-
47
-
48
-
49
-
50
-
51
-
52
-
53
-
54
-
55
-
56
-
57
-
58
-
59
-
60
-
61
-
62
-
63
-
64
-
65
-
66
-
67
-
68
-
69
-
70
-
71
-
72
-
73
-
74
-
75
-
76
-
77
-
78
-
79
-
80
-
81
-
82
-
83
-
84
-
85
-
86
-
87
-
88
-
89
-
90
-
91
-
92
-
93
-
94
-
95
-
96
-
97
-
98
-
99
-
100
-
101
-
102
-
103
-
104
-
105
-
106
-
107
-
108
-
109
-
110
-
111
-
112
-
113
-
114
-
115
-
116
-
117
-
118
-
119
-
120
-
121
-
122
-
123
-
124
-
125
-
126
-
127
-
128
-
129
-
130
-
131
-
132
-
133
-
134
-
135
-
136
-
137
-
138
-
139
-
140
-
141
-
142
-
143
-
144
-
145
-
146
-
147
-
148
-
149
-
150
-
151
-
152
-
153
-
154
-
155
-
156
-
157
-
158
-
159
-
160
-
161
-
162
-
163
-
164
-
165
-
166
-
167
-
168
-
169
-
170
-
171
-
172
-
173
-
174
-
175
-
176
-
177
-
178
-
179
-
180
-
181
-
182
-
183
-
184
-
185
-
186
-
187
-
188
-
189
-
190
-
191
-
192
-
193
-
194
-
195
-
196
-
197
-
198
-
199
-
200
-
201
-
202
-
203
-
 204
204 -
 205
205 -
 206
206 -
 207
207 -
 208
208 -
 209
209 -
 210
210 -
 211
211 -
 212
212 -
 213
213 -
 214
214 -
 215
215 -
 216
216 -
 217
217 -
 218
218 -
 219
219 -
 220
220 -
 221
221 -
 222
222 -
 223
223 -
 224
224 -
225
-
226
-
227
-
228
-
229
-
230
-
231
-
232
-
233
-
234
-
235
-
236
-
237
-
238
-
239
-
240
-
241
-
242
-
243
-
244
-
245
-
246
-
247
-
248
-
249
-
250
-
251
-
252
-
253
-
254
-
255
-
256
-
257
-
258
-
259
-
260
-
261
-
262
-
263
-
264
-
265
-
266
-
267
-
268
-
269
-
270
-
271
-
272
-
273
-
274
-
275
-
276
-
277
-
278
-
279
-
280
-
281
-
282
-
283
-
284
-
285
-
286
-
287
-
288
-
289
-
290
-
291
-
292
-
293
-
294
-
295
-
296
-
297
-
298
-
299
-
300
-
301
-
302
-
303
-
304
-
305
-
306
-
307
-
308
-
309
-
310
-
311
-
312
 |
 |

212
Mortgage-backed securities
For U.S. mortgage-backed securities (and in particular for Alt-A and other
mortgage-backed securities that have significant unrealized losses as a
percentage of amortized cost), credit impairment is assessed using a cash
flow model that estimates the cash flows on the underlying mortgages, using
the security-specific collateral and transaction structure. The model estimates
cash flows from the underlying mortgage loans and distributes those cash
flows to various tranches of securities, considering the transaction structure
and any subordination and credit enhancements that exist in that structure.
The cash flow model incorporates actual cash flows on the mortgage-backed
securities through the current period and then projects the remaining cash
flows using a number of assumptions, including default rates, prepayment
rates, and recovery rates (on foreclosed properties).
Management develops specific assumptions using as much market data
as possible and includes internal estimates as well as estimates published
by rating agencies and other third-party sources. Default rates are projected
by considering current underlying mortgage loan performance, generally
assuming the default of (1) 10% of current loans, (2) 25% of 30–59 day
delinquent loans, (3) 70% of 60–90 day delinquent loans and (4) 100%
of 91+ day delinquent loans. These estimates are extrapolated along a
default timing curve to estimate the total lifetime pool default rate. Other
assumptions used contemplate the actual collateral attributes, including
geographic concentrations, rating agency loss projections, rating actions and
current market prices.
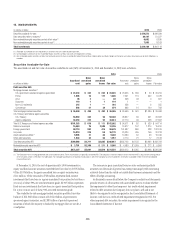
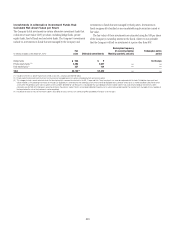
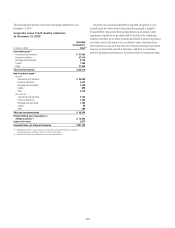
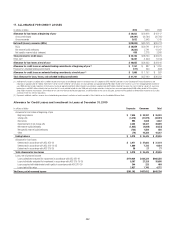
The key assumptions for mortgage-backed securities as of December 31,
2010 are in the table below:
December 31, 2010
Prepayment rate (1) 3%–8% CRR
Loss severity (2) 45%–85%
Unemployment rate 9.8%
(1) Conditional Repayment Rate (CRR) represents the annualized expected rate of voluntary prepayment
of principal for mortgage-backed securities over a certain period of time.
(2) Loss severity rates are estimated considering collateral characteristics and generally range from
45%–60% for prime bonds, 50%–85% for Alt-A bonds, and 65%–85% for subprime bonds.
The valuation as of December 31, 2010 assumes that U.S. housing prices
will increase 1.2% in 2011, increase 1.8% in 2012 and increase 3% per year
from 2013 onwards.
In addition, cash flow projections are developed using more stressful
parameters. Management assesses the results of those stress tests (including
the severity of any cash shortfall indicated and the likelihood of the stress
scenarios actually occurring based on the underlying pool’s characteristics
and performance) to assess whether management expects to recover the
amortized cost basis of the security. If cash flow projections indicate that the
Company does not expect to recover its amortized cost basis, the Company
recognizes the estimated credit loss in earnings.
State and municipal securities
Citigroup’s AFS state and municipal bonds consist mainly of bonds that are
financed through Tender Option Bond programs. The process for identifying
credit impairment for bonds in this program as well as for bonds that
were previously financed in this program is largely based on third-party
credit ratings. Individual bond positions must meet minimum ratings
requirements, which vary based on the sector of the bond issuer.
Citigroup monitors the bond issuer and insurer ratings on a daily basis.
The average portfolio rating, ignoring any insurance, is Aa3/AA-. In the event
of a downgrade of the bond below Aa3/AA-, the subject bond is specifically
reviewed for potential shortfall in contractual principal and interest.
Citigroup has not recorded any credit impairments on bonds held as part of
the Tender Option Bond program or on bonds that were previously held as
part of the Tender Option Bond program.
The remainder of Citigroup’s AFS state and municipal bonds are
specifically reviewed for credit impairment based on instrument-specific
estimates of cash flows, probability of default and loss given default.
Because Citigroup does not intend to sell the AFS state and municipal
bond securities or expect to be required to sell them prior to recovery, the
unrealized losses associated with the AFS state and municipal bond portfolio
(other than credit-related losses) remain classified in Accumulated other
comprehensive income and are not reclassified into earnings as other-than-
temporary impairment.
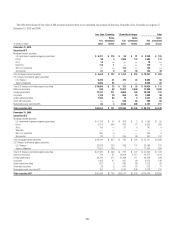
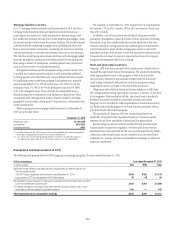
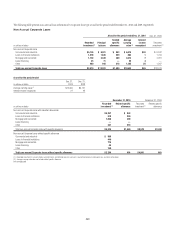
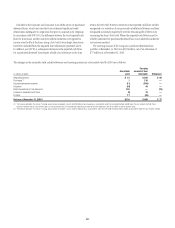
Recognition and Measurement of OTTI
The following table presents the total OTTI recognized in earnings during the 12 months ended December 31, 2010:
OTTI on Investments Year ended December 31, 2010
In millions of dollars AFS HTM Total
Impairment losses related to securities that the Company does not intend to sell nor will
likely be required to sell:
Total OTTI losses recognized during the year ended December 31, 2010 $ 298 $ 855 $ 1,153
Less: portion of OTTI loss recognized in AOCI (before taxes) 36 48 84
Net impairment losses recognized in earnings for securities that the Company does not intend
to sell nor will likely be required to sell $ 262 $ 807 $ 1,069
OTTI losses recognized in earnings for securities that the Company intends to sell or more-
likely-than-not will be required to sell before recovery 342 — 342
Total impairment losses recognized in earnings $ 604 $807 $1,411