Citibank 2010 Annual Report Download - page 56
Download and view the complete annual report
Please find page 56 of the 2010 Citibank annual report below. You can navigate through the pages in the report by either clicking on the pages listed below, or by using the keyword search tool below to find specific information within the annual report.-
 1
1 -
2
-
3
-
4
-
5
-
6
-
7
-
8
-
9
-
10
-
11
-
12
-
13
-
14
-
15
-
16
-
17
-
18
-
19
-
20
-
21
-
22
-
23
-
24
-
25
-
26
-
27
-
28
-
29
-
30
-
31
-
32
-
33
-
34
-
35
-
36
-
37
-
38
-
39
-
40
-
41
-
42
-
43
-
44
-
45
-
 46
46 -
 47
47 -
 48
48 -
 49
49 -
 50
50 -
 51
51 -
 52
52 -
 53
53 -
 54
54 -
 55
55 -
 56
56 -
 57
57 -
 58
58 -
 59
59 -
 60
60 -
 61
61 -
 62
62 -
 63
63 -
 64
64 -
 65
65 -
 66
66 -
67
-
68
-
69
-
70
-
71
-
72
-
73
-
74
-
75
-
76
-
77
-
78
-
79
-
80
-
81
-
82
-
83
-
84
-
85
-
86
-
87
-
88
-
89
-
90
-
91
-
92
-
93
-
94
-
95
-
96
-
97
-
98
-
99
-
100
-
101
-
102
-
103
-
104
-
105
-
106
-
107
-
108
-
109
-
110
-
111
-
112
-
113
-
114
-
115
-
116
-
117
-
118
-
119
-
120
-
121
-
122
-
123
-
124
-
125
-
126
-
127
-
128
-
129
-
130
-
131
-
132
-
133
-
134
-
135
-
136
-
137
-
138
-
139
-
140
-
141
-
142
-
143
-
144
-
145
-
146
-
147
-
148
-
149
-
150
-
151
-
152
-
153
-
154
-
155
-
156
-
157
-
158
-
159
-
160
-
161
-
162
-
163
-
164
-
165
-
166
-
167
-
168
-
169
-
170
-
171
-
172
-
173
-
174
-
175
-
176
-
177
-
178
-
179
-
180
-
181
-
182
-
183
-
184
-
185
-
186
-
187
-
188
-
189
-
190
-
191
-
192
-
193
-
194
-
195
-
196
-
197
-
198
-
199
-
200
-
201
-
202
-
203
-
204
-
205
-
206
-
207
-
208
-
209
-
210
-
211
-
212
-
213
-
214
-
215
-
216
-
217
-
218
-
219
-
220
-
221
-
222
-
223
-
224
-
225
-
226
-
227
-
228
-
229
-
230
-
231
-
232
-
233
-
234
-
235
-
236
-
237
-
238
-
239
-
240
-
241
-
242
-
243
-
244
-
245
-
246
-
247
-
248
-
249
-
250
-
251
-
252
-
253
-
254
-
255
-
256
-
257
-
258
-
259
-
260
-
261
-
262
-
263
-
264
-
265
-
266
-
267
-
268
-
269
-
270
-
271
-
272
-
273
-
274
-
275
-
276
-
277
-
278
-
279
-
280
-
281
-
282
-
283
-
284
-
285
-
286
-
287
-
288
-
289
-
290
-
291
-
292
-
293
-
294
-
295
-
296
-
297
-
298
-
299
-
300
-
301
-
302
-
303
-
304
-
305
-
306
-
307
-
308
-
309
-
310
-
311
-
312
 |
 |

54
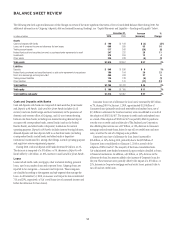
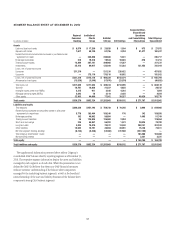
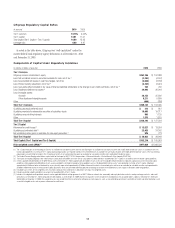
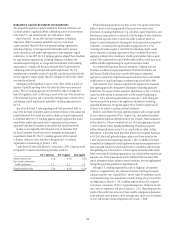
BALANCE SHEET REVIEW
The following sets forth a general discussion of the changes in certain of the more significant line items of Citi’s Consolidated Balance Sheet during 2010. For
additional information on Citigroup’s deposits, debt and secured financing (lending), see “Capital Resources and Liquidity—Funding and Liquidity” below.
In billions of dollars
December 31, Increase
(decrease)
%
Change2010 2009
Assets
Cash and deposits with banks $ 190 $ 193 $ (3) (2)%
Loans, net of unearned income and allowance for loan losses 608 555 53 10
Trading account assets 317 343 (26) (8)
Federal funds sold and securities borrowed or purchased under agreements to resell 247 222 25 11
Investments 318 306 12 4
Other assets 234 238 (4) (2)
Total assets $1,914 $1,857 $ 57 3%
Liabilities
Deposits $ 845 $ 836 $ 9 1%
Federal funds purchased and securities loaned or sold under agreements to repurchase 190 154 36 23
Short-term borrowings and long-term debt 460 433 27 6
Trading account liabilities 129 138 (9) (7)
Other liabilities 124 141 (17) (12)
Total liabilities $1,748 $1,702 $ 46 3%
Total equity $ 166 $ 155 $ 11 7%
Total liabilities and equity $1,914 $1,857 $ 57 3%
Cash and Deposits with Banks
Cash and deposits with banks are composed of Cash and due from banks
and Deposits with banks. Cash and due from banks includes (i) all
currency and coin (both foreign and local currencies) in the possession of
domestic and overseas offices of Citigroup, and (ii) non-interest-bearing
balances due from banks, including non-interest-bearing demand deposit
accounts with correspondent banks, central banks (such as the Federal
Reserve Bank), and other banks or depository institutions for normal
operating purposes. Deposits with banks includes interest-bearing balances,
demand deposits and time deposits held in or due from banks (including
correspondent banks, central banks and other banks or depository
institutions) maintained for, among other things, normal operating purposes
and regulatory reserve requirement purposes.
During 2010, cash and deposits with banks decreased $3 billion, or 2%.
The decrease is composed of a $5 billion, or 3%, decrease in Deposits with
banks offset by a $3 billion, or 10%, increase in Cash and due from banks.
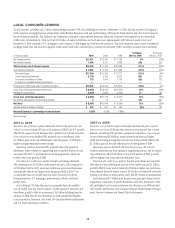
Loans
Loans include credit cards, mortgages, other real estate lending, personal
loans, auto loans, student loans and corporate loans. Citigroup loans are
reported in two categories—Consumer and Corporate. These categories
are classified according to the segment and sub-segment that manage the
loans. As of December 31, 2010, Consumer and Corporate loans constituted
71% and 29%, respectively, of Citi’s total loans (net of unearned income and
before the allowance for loan losses).
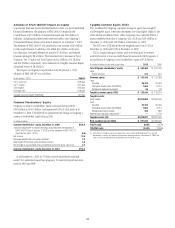
Consumer loans (net of allowance for loan losses) increased by $27 billion,
or 7%, during 2010. On January 1, 2010, approximately $120 billion of
Consumer loans (primarily credit card receivables and student loans, net of
$13 billion in allowance for loan loss reserves) were consolidated as a result of
the adoption of SFAS 166/167. The increase in credit cards and student loans
as a result of the adoption of SFAS 166/167 was partially offset by paydowns
over the year on credit cards and the sale of The Student Loan Corporation.
Also offsetting the increase was a $27 billion, or 12%, decrease in Consumer
mortgage and real estate loans, driven by run-off, net credit losses and asset
sales, as well as the sale of a Citigroup auto portfolio.
Corporate loans (net of allowance for loan losses) increased by
$26 billion, or 16%, during 2010, primarily due to the $28 billion of
Corporate loans consolidated as of January 1, 2010 as a result of the
adoption of SFAS 166/167. The majority of the loans consolidated were
Citi-administered asset-backed commercial paper conduits classified as loans
to financial institutions. In addition, a $2 billion, or 32%, decrease in the
allowance for loan loss reserves added to the increase of Corporate loans for
the year. These increases were partially offset by the impact of a $7 billion, or
21%, decrease in Corporate mortgage and real estate loans, primarily due to
run-off and net credit losses.