Citibank 2010 Annual Report Download - page 45
Download and view the complete annual report
Please find page 45 of the 2010 Citibank annual report below. You can navigate through the pages in the report by either clicking on the pages listed below, or by using the keyword search tool below to find specific information within the annual report.-
 1
1 -
2
-
3
-
4
-
5
-
6
-
7
-
8
-
9
-
10
-
11
-
12
-
13
-
14
-
15
-
16
-
17
-
18
-
19
-
20
-
21
-
22
-
23
-
24
-
25
-
26
-
27
-
28
-
29
-
30
-
31
-
32
-
33
-
34
-
 35
35 -
 36
36 -
 37
37 -
 38
38 -
 39
39 -
 40
40 -
 41
41 -
 42
42 -
 43
43 -
 44
44 -
 45
45 -
 46
46 -
 47
47 -
 48
48 -
 49
49 -
 50
50 -
 51
51 -
 52
52 -
 53
53 -
 54
54 -
 55
55 -
56
-
57
-
58
-
59
-
60
-
61
-
62
-
63
-
64
-
65
-
66
-
67
-
68
-
69
-
70
-
71
-
72
-
73
-
74
-
75
-
76
-
77
-
78
-
79
-
80
-
81
-
82
-
83
-
84
-
85
-
86
-
87
-
88
-
89
-
90
-
91
-
92
-
93
-
94
-
95
-
96
-
97
-
98
-
99
-
100
-
101
-
102
-
103
-
104
-
105
-
106
-
107
-
108
-
109
-
110
-
111
-
112
-
113
-
114
-
115
-
116
-
117
-
118
-
119
-
120
-
121
-
122
-
123
-
124
-
125
-
126
-
127
-
128
-
129
-
130
-
131
-
132
-
133
-
134
-
135
-
136
-
137
-
138
-
139
-
140
-
141
-
142
-
143
-
144
-
145
-
146
-
147
-
148
-
149
-
150
-
151
-
152
-
153
-
154
-
155
-
156
-
157
-
158
-
159
-
160
-
161
-
162
-
163
-
164
-
165
-
166
-
167
-
168
-
169
-
170
-
171
-
172
-
173
-
174
-
175
-
176
-
177
-
178
-
179
-
180
-
181
-
182
-
183
-
184
-
185
-
186
-
187
-
188
-
189
-
190
-
191
-
192
-
193
-
194
-
195
-
196
-
197
-
198
-
199
-
200
-
201
-
202
-
203
-
204
-
205
-
206
-
207
-
208
-
209
-
210
-
211
-
212
-
213
-
214
-
215
-
216
-
217
-
218
-
219
-
220
-
221
-
222
-
223
-
224
-
225
-
226
-
227
-
228
-
229
-
230
-
231
-
232
-
233
-
234
-
235
-
236
-
237
-
238
-
239
-
240
-
241
-
242
-
243
-
244
-
245
-
246
-
247
-
248
-
249
-
250
-
251
-
252
-
253
-
254
-
255
-
256
-
257
-
258
-
259
-
260
-
261
-
262
-
263
-
264
-
265
-
266
-
267
-
268
-
269
-
270
-
271
-
272
-
273
-
274
-
275
-
276
-
277
-
278
-
279
-
280
-
281
-
282
-
283
-
284
-
285
-
286
-
287
-
288
-
289
-
290
-
291
-
292
-
293
-
294
-
295
-
296
-
297
-
298
-
299
-
300
-
301
-
302
-
303
-
304
-
305
-
306
-
307
-
308
-
309
-
310
-
311
-
312
 |
 |

43
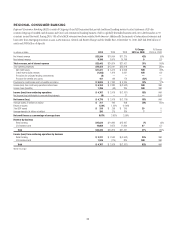
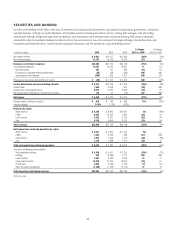
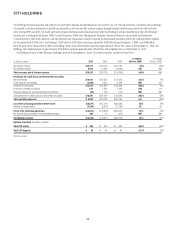
SECURITIES AND BANKING
Securities and Banking (S&B) offers a wide array of investment and commercial banking services and products for corporations, governments, institutional
and retail investors, and high-net-worth individuals. S&B includes investment banking and advisory services, lending, debt and equity sales and trading,
institutional brokerage, foreign exchange, structured products, cash instruments and related derivatives, and private banking. S&B revenue is generated
primarily from fees for investment banking and advisory services, fees and interest on loans, fees and spread on foreign exchange, structured products, cash
instruments and related derivatives, income earned on principal transactions, and fees and spreads on private banking services.
In millions of dollars 2010 2009 2008
% Change
2010 vs. 2009
% Change
2009 vs. 2008
Net interest revenue $ 9,927 $12,377 $12,568 (20)% (2)%
Non-interest revenue 13,157 14,732 12,160 (11) 21
Revenues, net of interest expense $23,084 $27,109 $24,728 (15)% 10%
Total operating expenses 14,537 13,084 15,851 11 (17)
Net credit losses 563 742 898 (24) (17)
Provisions for unfunded lending commitments (28) 138 (185) NM NM
Credit reserve build (release) (560) 892 1,291 NM (31)
Provisions for loan losses and benefits and claims $ (25) $ 1,772 $ 2,004 NM (12)%
Income before taxes and noncontrolling interests $ 8,572 $12,253 $ 6,873 (30)% 78%
Income taxes 1,993 3,068 807 (35) NM
Income from continuing operations 6,579 9,185 6,066 (28) 51
Net income (loss) attributable to noncontrolling interests 110 55 (13) 100 NM
Net income $ 6,469 $ 9,130 $ 6,079 (29)% 50%
Average assets (in billions of dollars) $ 875 $ 786 $ 986 11% (20)%
Return on assets 0.74% 1.16% 0.62%
Revenues by region
North America $ 9,392 $ 8,833 $10,821 6% (18)%
EMEA 6,842 10,049 5,963 (32) 69
Latin America 2,532 3,421 2,374 (26) 44
Asia 4,318 4,806 5,570 (10) (14)
Total revenues $23,084 $27,109 $24,728 (15)% 10%
Net income from continuing operations by region
North America $ 2,537 $ 2,385 $ 2,395 6% —
EMEA 1,832 3,426 588 (47) NM
Latin America 1,072 1,536 1,113 (30) 38%
Asia 1,138 1,838 1,970 (38) (7)
Total net income from continuing operations $ 6,579 $ 9,185 $ 6,066 (28)% 51%
Securities and Banking revenue details
Total investment banking $ 3,828 $ 4,767 $ 3,251 (20)% 47%
Lending 932 (2,480) 4,771 NM NM
Equity markets 3,501 3,183 2,878 10 11
Fixed income markets 14,075 21,296 13,606 (34) 57
Private bank 2,004 2,068 2,326 (3) (11)
Other Securities and Banking (1,256) (1,725) (2,104) 27 18
Total Securities and Banking revenues $23,084 $27,109 $24,728 (15)% 10%
NM Not meaningful