Citibank 2010 Annual Report Download - page 58
Download and view the complete annual report
Please find page 58 of the 2010 Citibank annual report below. You can navigate through the pages in the report by either clicking on the pages listed below, or by using the keyword search tool below to find specific information within the annual report.-
 1
1 -
2
-
3
-
4
-
5
-
6
-
7
-
8
-
9
-
10
-
11
-
12
-
13
-
14
-
15
-
16
-
17
-
18
-
19
-
20
-
21
-
22
-
23
-
24
-
25
-
26
-
27
-
28
-
29
-
30
-
31
-
32
-
33
-
34
-
35
-
36
-
37
-
38
-
39
-
40
-
41
-
42
-
43
-
44
-
45
-
46
-
47
-
 48
48 -
 49
49 -
 50
50 -
 51
51 -
 52
52 -
 53
53 -
 54
54 -
 55
55 -
 56
56 -
 57
57 -
 58
58 -
 59
59 -
 60
60 -
 61
61 -
 62
62 -
 63
63 -
 64
64 -
 65
65 -
 66
66 -
 67
67 -
 68
68 -
69
-
70
-
71
-
72
-
73
-
74
-
75
-
76
-
77
-
78
-
79
-
80
-
81
-
82
-
83
-
84
-
85
-
86
-
87
-
88
-
89
-
90
-
91
-
92
-
93
-
94
-
95
-
96
-
97
-
98
-
99
-
100
-
101
-
102
-
103
-
104
-
105
-
106
-
107
-
108
-
109
-
110
-
111
-
112
-
113
-
114
-
115
-
116
-
117
-
118
-
119
-
120
-
121
-
122
-
123
-
124
-
125
-
126
-
127
-
128
-
129
-
130
-
131
-
132
-
133
-
134
-
135
-
136
-
137
-
138
-
139
-
140
-
141
-
142
-
143
-
144
-
145
-
146
-
147
-
148
-
149
-
150
-
151
-
152
-
153
-
154
-
155
-
156
-
157
-
158
-
159
-
160
-
161
-
162
-
163
-
164
-
165
-
166
-
167
-
168
-
169
-
170
-
171
-
172
-
173
-
174
-
175
-
176
-
177
-
178
-
179
-
180
-
181
-
182
-
183
-
184
-
185
-
186
-
187
-
188
-
189
-
190
-
191
-
192
-
193
-
194
-
195
-
196
-
197
-
198
-
199
-
200
-
201
-
202
-
203
-
204
-
205
-
206
-
207
-
208
-
209
-
210
-
211
-
212
-
213
-
214
-
215
-
216
-
217
-
218
-
219
-
220
-
221
-
222
-
223
-
224
-
225
-
226
-
227
-
228
-
229
-
230
-
231
-
232
-
233
-
234
-
235
-
236
-
237
-
238
-
239
-
240
-
241
-
242
-
243
-
244
-
245
-
246
-
247
-
248
-
249
-
250
-
251
-
252
-
253
-
254
-
255
-
256
-
257
-
258
-
259
-
260
-
261
-
262
-
263
-
264
-
265
-
266
-
267
-
268
-
269
-
270
-
271
-
272
-
273
-
274
-
275
-
276
-
277
-
278
-
279
-
280
-
281
-
282
-
283
-
284
-
285
-
286
-
287
-
288
-
289
-
290
-
291
-
292
-
293
-
294
-
295
-
296
-
297
-
298
-
299
-
300
-
301
-
302
-
303
-
304
-
305
-
306
-
307
-
308
-
309
-
310
-
311
-
312
 |
 |
56
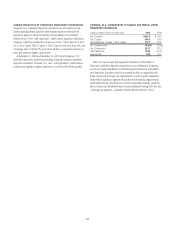
For further information regarding Goodwill and Intangible assets,
see Note 18 to the Consolidated Financial Statements. For further
information on Brokerage receivables, see Note 13 to the Consolidated
Financial Statements.
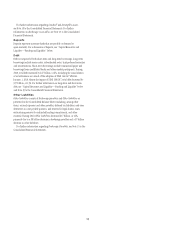
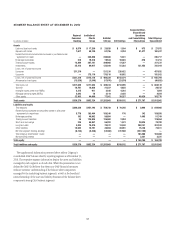
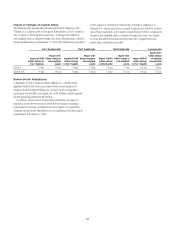
Deposits
Deposits represent customer funds that are payable on demand or
upon maturity. For a discussion of deposits, see “Capital Resources and
Liquidity—Funding and Liquidity” below.
Debt
Debt is composed of both short-term and long-term borrowings. Long-term
borrowings include senior notes, subordinated notes, trust preferred securities
and securitizations. Short-term borrowings include commercial paper and
borrowings from unaffiliated banks and other market participants. During
2010, total debt increased by $27 billion, or 6%, including the consolidation
of securitizations as a result of the adoption of SFAS 166/167 effective
January 1, 2010. Absent the impact of SFAS 166/167, total debt decreased by
$57 billion, or 13%. For further information on long-term and short-term
debt, see “Capital Resources and Liquidity—Funding and Liquidity” below
and Note 19 to the Consolidated Financial Statements.
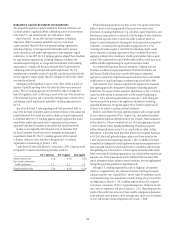
Other Liabilities
Other liabilities consists of Brokerage payables and Other liabilities as
presented on the Consolidated Balance Sheet (including, among other
items, accrued expenses and other payables, deferred tax liabilities, end-user
derivatives in a net payable position, and reserves for legal claims, taxes,
restructuring reserves for unfunded lending commitments, and other
matters). During 2010, Other liabilities decreased $17 billion, or 12%,
primarily due to a $9 billion decrease in brokerage payables and a $7 billion
decrease in other liabilities.
For further information regarding Brokerage Payables, see Note 13 to the
Consolidated Financial Statements.