Citibank 2010 Annual Report Download - page 52
Download and view the complete annual report
Please find page 52 of the 2010 Citibank annual report below. You can navigate through the pages in the report by either clicking on the pages listed below, or by using the keyword search tool below to find specific information within the annual report.-
 1
1 -
2
-
3
-
4
-
5
-
6
-
7
-
8
-
9
-
10
-
11
-
12
-
13
-
14
-
15
-
16
-
17
-
18
-
19
-
20
-
21
-
22
-
23
-
24
-
25
-
26
-
27
-
28
-
29
-
30
-
31
-
32
-
33
-
34
-
35
-
36
-
37
-
38
-
39
-
40
-
41
-
 42
42 -
 43
43 -
 44
44 -
 45
45 -
 46
46 -
 47
47 -
 48
48 -
 49
49 -
 50
50 -
 51
51 -
 52
52 -
 53
53 -
 54
54 -
 55
55 -
 56
56 -
 57
57 -
 58
58 -
 59
59 -
 60
60 -
 61
61 -
 62
62 -
63
-
64
-
65
-
66
-
67
-
68
-
69
-
70
-
71
-
72
-
73
-
74
-
75
-
76
-
77
-
78
-
79
-
80
-
81
-
82
-
83
-
84
-
85
-
86
-
87
-
88
-
89
-
90
-
91
-
92
-
93
-
94
-
95
-
96
-
97
-
98
-
99
-
100
-
101
-
102
-
103
-
104
-
105
-
106
-
107
-
108
-
109
-
110
-
111
-
112
-
113
-
114
-
115
-
116
-
117
-
118
-
119
-
120
-
121
-
122
-
123
-
124
-
125
-
126
-
127
-
128
-
129
-
130
-
131
-
132
-
133
-
134
-
135
-
136
-
137
-
138
-
139
-
140
-
141
-
142
-
143
-
144
-
145
-
146
-
147
-
148
-
149
-
150
-
151
-
152
-
153
-
154
-
155
-
156
-
157
-
158
-
159
-
160
-
161
-
162
-
163
-
164
-
165
-
166
-
167
-
168
-
169
-
170
-
171
-
172
-
173
-
174
-
175
-
176
-
177
-
178
-
179
-
180
-
181
-
182
-
183
-
184
-
185
-
186
-
187
-
188
-
189
-
190
-
191
-
192
-
193
-
194
-
195
-
196
-
197
-
198
-
199
-
200
-
201
-
202
-
203
-
204
-
205
-
206
-
207
-
208
-
209
-
210
-
211
-
212
-
213
-
214
-
215
-
216
-
217
-
218
-
219
-
220
-
221
-
222
-
223
-
224
-
225
-
226
-
227
-
228
-
229
-
230
-
231
-
232
-
233
-
234
-
235
-
236
-
237
-
238
-
239
-
240
-
241
-
242
-
243
-
244
-
245
-
246
-
247
-
248
-
249
-
250
-
251
-
252
-
253
-
254
-
255
-
256
-
257
-
258
-
259
-
260
-
261
-
262
-
263
-
264
-
265
-
266
-
267
-
268
-
269
-
270
-
271
-
272
-
273
-
274
-
275
-
276
-
277
-
278
-
279
-
280
-
281
-
282
-
283
-
284
-
285
-
286
-
287
-
288
-
289
-
290
-
291
-
292
-
293
-
294
-
295
-
296
-
297
-
298
-
299
-
300
-
301
-
302
-
303
-
304
-
305
-
306
-
307
-
308
-
309
-
310
-
311
-
312
 |
 |

50
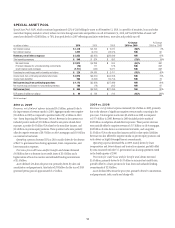
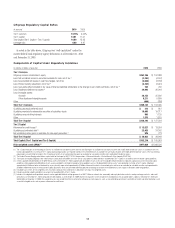
SPECIAL ASSET POOL
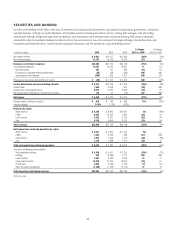
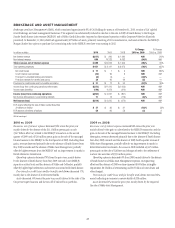
Special Asset Pool (SAP), which constituted approximately 22% of Citi Holdings by assets as of December 31, 2010, is a portfolio of securities, loans and other
assets that Citigroup intends to actively reduce over time through asset sales and portfolio run-off. At December 31, 2010, SAP had $80 billion of assets. SAP
assets have declined by $248 billion, or 76%, from peak levels in 2007 reflecting cumulative write-downs, asset sales and portfolio run-off.
In millions of dollars 2010 2009 2008
% Change
2010 vs. 2009
% Change
2009 vs. 2008
Net interest revenue $ 1,219 $ 2,754 $ 2,676 (56)% 3%
Non-interest revenue 1,633 (6,014) (42,375) NM 86
Revenues, net of interest expense $ 2,852 $(3,260) $(39,699) NM 92%
Total operating expenses $ 548 $ 824 $ 893 (33)% (8)%
Net credit losses $ 2,013 $ 5,399 $ 906 (63)% NM
Provision (releases) for unfunded lending commitments (76) 111 (172) NM NM
Credit reserve builds (releases) (1,711) (530) 2,677 NM NM
Provisions for credit losses and for benefits and claims $ 226 $ 4,980 $ 3,411 (95)% 46%
Income (loss) from continuing operations before taxes $ 2,078 $(9,064) $(44,003) NM 79%
Income taxes (benefits) 905 (3,695) (16,714) NM 78
Net income (loss) from continuing operations $ 1,173 $(5,369) $(27,289) NM 80%
Net income (loss) attributable to noncontrolling interests 188 (16) (205) NM 92
Net income (loss) $ 985 $(5,353) $(27,084) NM 80%
EOP assets (in billions of dollars) $ 80 $ 136 $ 219 (41)% (38)%
NM Not meaningful
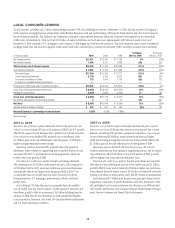
2010 vs. 2009
Revenues, net of interest expense increased $6.1 billion, primarily due to
the improvement of revenue marks in 2010. Aggregate marks were negative
$2.6 billion in 2009 as compared to positive marks of $3.4 billion in 2010
(see “Items Impacting SAP Revenues” below). Revenue in the current year
included positive marks of $2.0 billion related to sub-prime related direct
exposure, a positive $0.5 billion CVA related to the monoline insurers, and
$0.4 billion on private equity positions. These positive marks were partially
offset by negative revenues of $0.5 billion on Alt-A mortgages and $0.4 billion
on commercial real estate.
Operating expenses decreased 33% in 2010, mainly driven by the absence
of the U.S. government loss-sharing agreement, lower compensation, and
lower transaction expenses.
Provisions for credit losses and for benefits and claims decreased
$4.8 billion due to a decrease in net credit losses of $3.4 billion and a
higher release of loan loss reserves and unfunded lending commitments
of $1.4 billion.
Assets declined 41% from the prior year, primarily driven by sales and
amortization and prepayments. Asset sales of $39 billion for the year of 2010
generated pretax gains of approximately $1.3 billion.
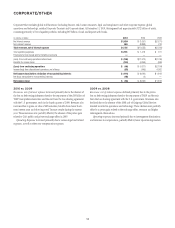
2009 vs. 2008
Revenues, net of interest expense increased $36.4 billion in 2009, primarily
due to the absence of significant negative revenue marks occurring in the
prior year. Total negative marks were $2.6 billion in 2009 as compared
to $37.4 billion in 2008. Revenue in 2009 included positive marks of
$0.8 billion on subprime-related direct exposures. These positive revenues
were partially offset by negative revenues of $1.5 billion on Alt-A mortgages,
$0.8 billion of write-downs on commercial real estate, and a negative
$1.6 billion CVA on the monoline insurers and fair value option liabilities.
Revenue was also affected by negative marks on private equity positions and
write-downs on highly leveraged finance commitments.
Operating expenses decreased 8% in 2009, mainly driven by lower
compensation and lower volumes and transaction expenses, partially offset
by costs associated with the U.S. government loss-sharing agreement exited
in the fourth quarter of 2009.
Provisions for credit losses and for benefits and claims increased
$1.6 billion, primarily driven by $4.5 billion in increased net credit losses,
partially offset by a lower provision for loan losses and unfunded lending
commitments of $2.9 billion.
Assets declined 38% versus the prior year, primarily driven by amortization
and prepayments, sales, marks and charge-offs.