Citibank 2010 Annual Report Download - page 268
Download and view the complete annual report
Please find page 268 of the 2010 Citibank annual report below. You can navigate through the pages in the report by either clicking on the pages listed below, or by using the keyword search tool below to find specific information within the annual report.-
 1
1 -
2
-
3
-
4
-
5
-
6
-
7
-
8
-
9
-
10
-
11
-
12
-
13
-
14
-
15
-
16
-
17
-
18
-
19
-
20
-
21
-
22
-
23
-
24
-
25
-
26
-
27
-
28
-
29
-
30
-
31
-
32
-
33
-
34
-
35
-
36
-
37
-
38
-
39
-
40
-
41
-
42
-
43
-
44
-
45
-
46
-
47
-
48
-
49
-
50
-
51
-
52
-
53
-
54
-
55
-
56
-
57
-
58
-
59
-
60
-
61
-
62
-
63
-
64
-
65
-
66
-
67
-
68
-
69
-
70
-
71
-
72
-
73
-
74
-
75
-
76
-
77
-
78
-
79
-
80
-
81
-
82
-
83
-
84
-
85
-
86
-
87
-
88
-
89
-
90
-
91
-
92
-
93
-
94
-
95
-
96
-
97
-
98
-
99
-
100
-
101
-
102
-
103
-
104
-
105
-
106
-
107
-
108
-
109
-
110
-
111
-
112
-
113
-
114
-
115
-
116
-
117
-
118
-
119
-
120
-
121
-
122
-
123
-
124
-
125
-
126
-
127
-
128
-
129
-
130
-
131
-
132
-
133
-
134
-
135
-
136
-
137
-
138
-
139
-
140
-
141
-
142
-
143
-
144
-
145
-
146
-
147
-
148
-
149
-
150
-
151
-
152
-
153
-
154
-
155
-
156
-
157
-
158
-
159
-
160
-
161
-
162
-
163
-
164
-
165
-
166
-
167
-
168
-
169
-
170
-
171
-
172
-
173
-
174
-
175
-
176
-
177
-
178
-
179
-
180
-
181
-
182
-
183
-
184
-
185
-
186
-
187
-
188
-
189
-
190
-
191
-
192
-
193
-
194
-
195
-
196
-
197
-
198
-
199
-
200
-
201
-
202
-
203
-
204
-
205
-
206
-
207
-
208
-
209
-
210
-
211
-
212
-
213
-
214
-
215
-
216
-
217
-
218
-
219
-
220
-
221
-
222
-
223
-
224
-
225
-
226
-
227
-
228
-
229
-
230
-
231
-
232
-
233
-
234
-
235
-
236
-
237
-
238
-
239
-
240
-
241
-
242
-
243
-
244
-
245
-
246
-
247
-
248
-
249
-
250
-
251
-
252
-
253
-
254
-
255
-
256
-
257
-
 258
258 -
 259
259 -
 260
260 -
 261
261 -
 262
262 -
 263
263 -
 264
264 -
 265
265 -
 266
266 -
 267
267 -
 268
268 -
 269
269 -
 270
270 -
 271
271 -
 272
272 -
 273
273 -
 274
274 -
 275
275 -
 276
276 -
 277
277 -
 278
278 -
279
-
280
-
281
-
282
-
283
-
284
-
285
-
286
-
287
-
288
-
289
-
290
-
291
-
292
-
293
-
294
-
295
-
296
-
297
-
298
-
299
-
300
-
301
-
302
-
303
-
304
-
305
-
306
-
307
-
308
-
309
-
310
-
311
-
312
 |
 |

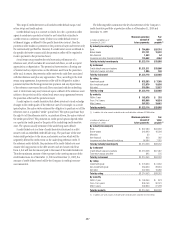
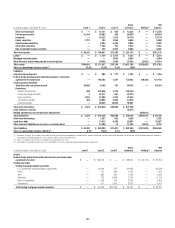
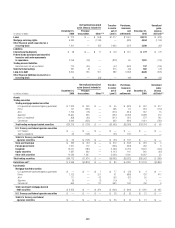
266
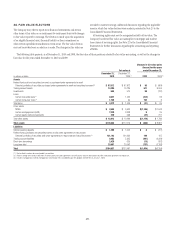
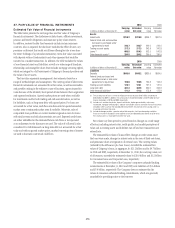
In millions of dollars at December 31, 2009 Level 1 Level 2 Level 3
Gross
inventory Netting (1)
Net
balance
U.S. Treasury and federal agencies securities
U.S. Treasury $ 27,943 $ 995 $ — $ 28,938 $ — $ 28,938
Agency obligations — 2,041 — 2,041 — 2,041
Total U.S. Treasury and federal agencies securities $ 27,943 $ 3,036 $ — $ 30,979 $ — $ 30,979
Other trading securities
State and municipal $ — $ 6,925 $ 222 $ 7,147 $ — $ 7,147
Foreign government 59,229 13,081 459 72,769 — 72,769
Corporate — 43,758 8,620 52,378 — 52,378
Equity securities 33,754 11,827 640 46,221 — 46,221
Other debt securities — 19,976 16,237 36,213 — 36,213
Total trading securities $120,926 $ 123,026 $39,942 $ 283,894 $ — $283,894
Derivatives $ 4,002 $ 671,532 $27,685 $ 703,219 $ (644,340) $ 58,879
Investments
Mortgage-backed securities
U.S. government-sponsored agency guaranteed $ 89 $ 20,823 $ 2 $ 20,914 $ — $ 20,914
Prime — 5,742 736 6,478 — 6,478
Alt-A — 572 55 627 — 627
Subprime — — 1 1 — 1
Non-U.S. residential — 255 — 255 — 255
Commercial — 47 746 793 — 793
Total investment mortgage-backed securities $ 89 $ 27,439 $ 1,540 $ 29,068 $ — $ 29,068
U.S. Treasury and federal agency securities
U.S. Treasury $ 5,943 $ 20,619 $ — $ 26,562 $ — $ 26,562
Agency obligations — 27,531 21 27,552 — 27,552
Total U.S. Treasury and federal agency $ 5,943 $ 48,150 $ 21 $ 54,114 $ — $ 54,114
State and municipal $ — $ 15,393 $ 217 $ 15,610 $ — $ 15,610
Foreign government 60,484 41,765 270 102,519 — 102,519
Corporate — 19,056 1,257 20,313 — 20,313
Equity securities 3,056 237 2,513 5,806 — 5,806
Other debt securities — 3,337 8,832 12,169 — 12,169
Non-marketable equity securities — 77 6,753 6,830 — 6,830
Total investments $ 69,572 $ 155,454 $21,403 $ 246,429 $ — $246,429
Loans (2) $ — $ 1,226 $ 213 $ 1,439 $ — $ 1,439
Mortgage servicing rights — — 6,530 6,530 — 6,530
Other financial assets measured on a recurring basis — 15,787 1,101 16,888 (4,224) 12,664
Total assets $194,500 $1,105,550 $96,874 $1,396,924 $(699,277) $697,647
Total as a percentage of gross assets (3) 13.9% 79.2% 6.9% 100%
Liabilities
Interest-bearing deposits $ — $ 1,517 $ 28 $ 1,545 $ — $ 1,545
Federal funds purchased and securities loaned or sold under
agreements to repurchase — 152,687 2,056 154,743 (50,713) 104,030
Trading account liabilities
Securities sold, not yet purchased 52,399 20,233 774 73,406 — 73,406
Derivatives 4,980 669,384 24,577 698,941 (634,835) 64,106
Short-term borrowings — 408 231 639 — 639
Long-term debt — 16,288 9,654 25,942 — 25,942
Other financial liabilities measured on a recurring basis — 15,753 13 15,766 (4,224) 11,542
Total liabilities $ 57,379 $ 876,270 $37,333 $ 970,982 $(689,772) $281,210
Total as a percentage of gross liabilities (3) 5.9% 90.2% 3.8% 100%
(1) Represents netting of: (i) the amounts due under securities purchased under agreements to resell and the amounts owed under securities sold under agreements to repurchase, and (ii) derivative exposures covered by
a qualifying master netting agreement, cash collateral, and the market value adjustment.
(2) There is no allowance for loan losses recorded for loans reported at fair value.
(3) Percentage is calculated based on total assets and liabilities at fair value, excluding collateral paid/received on derivatives.