Citibank 2010 Annual Report Download - page 195
Download and view the complete annual report
Please find page 195 of the 2010 Citibank annual report below. You can navigate through the pages in the report by either clicking on the pages listed below, or by using the keyword search tool below to find specific information within the annual report.-
 1
1 -
2
-
3
-
4
-
5
-
6
-
7
-
8
-
9
-
10
-
11
-
12
-
13
-
14
-
15
-
16
-
17
-
18
-
19
-
20
-
21
-
22
-
23
-
24
-
25
-
26
-
27
-
28
-
29
-
30
-
31
-
32
-
33
-
34
-
35
-
36
-
37
-
38
-
39
-
40
-
41
-
42
-
43
-
44
-
45
-
46
-
47
-
48
-
49
-
50
-
51
-
52
-
53
-
54
-
55
-
56
-
57
-
58
-
59
-
60
-
61
-
62
-
63
-
64
-
65
-
66
-
67
-
68
-
69
-
70
-
71
-
72
-
73
-
74
-
75
-
76
-
77
-
78
-
79
-
80
-
81
-
82
-
83
-
84
-
85
-
86
-
87
-
88
-
89
-
90
-
91
-
92
-
93
-
94
-
95
-
96
-
97
-
98
-
99
-
100
-
101
-
102
-
103
-
104
-
105
-
106
-
107
-
108
-
109
-
110
-
111
-
112
-
113
-
114
-
115
-
116
-
117
-
118
-
119
-
120
-
121
-
122
-
123
-
124
-
125
-
126
-
127
-
128
-
129
-
130
-
131
-
132
-
133
-
134
-
135
-
136
-
137
-
138
-
139
-
140
-
141
-
142
-
143
-
144
-
145
-
146
-
147
-
148
-
149
-
150
-
151
-
152
-
153
-
154
-
155
-
156
-
157
-
158
-
159
-
160
-
161
-
162
-
163
-
164
-
165
-
166
-
167
-
168
-
169
-
170
-
171
-
172
-
173
-
174
-
175
-
176
-
177
-
178
-
179
-
180
-
181
-
182
-
183
-
184
-
 185
185 -
 186
186 -
 187
187 -
 188
188 -
 189
189 -
 190
190 -
 191
191 -
 192
192 -
 193
193 -
 194
194 -
 195
195 -
 196
196 -
 197
197 -
 198
198 -
 199
199 -
 200
200 -
 201
201 -
 202
202 -
 203
203 -
 204
204 -
 205
205 -
206
-
207
-
208
-
209
-
210
-
211
-
212
-
213
-
214
-
215
-
216
-
217
-
218
-
219
-
220
-
221
-
222
-
223
-
224
-
225
-
226
-
227
-
228
-
229
-
230
-
231
-
232
-
233
-
234
-
235
-
236
-
237
-
238
-
239
-
240
-
241
-
242
-
243
-
244
-
245
-
246
-
247
-
248
-
249
-
250
-
251
-
252
-
253
-
254
-
255
-
256
-
257
-
258
-
259
-
260
-
261
-
262
-
263
-
264
-
265
-
266
-
267
-
268
-
269
-
270
-
271
-
272
-
273
-
274
-
275
-
276
-
277
-
278
-
279
-
280
-
281
-
282
-
283
-
284
-
285
-
286
-
287
-
288
-
289
-
290
-
291
-
292
-
293
-
294
-
295
-
296
-
297
-
298
-
299
-
300
-
301
-
302
-
303
-
304
-
305
-
306
-
307
-
308
-
309
-
310
-
311
-
312
 |
 |

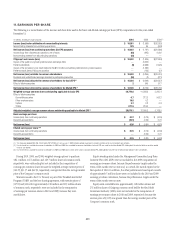
193
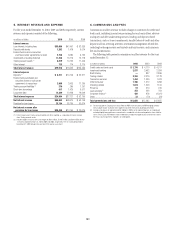
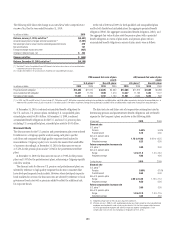
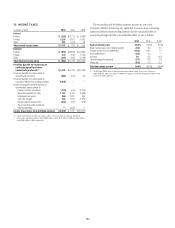
The following table shows the change in Accumulated other comprehensive
income (loss) for the year ended December 31, 2010:
In millions of dollars 2010
Balance, January 1, 2010, net of tax (1) $(3,461)
Actuarial assumptions changes and plan experience (2) (1,257)
Net asset gain due to actual returns exceeding expected returns 479
Net amortizations 137
Foreign exchange impact and other (437)
Change in deferred taxes, net $ 434
Change, net of tax $ (644)
Balance, December 31, 2010, net of tax (1) $(4,105)
(1) See Note 21 to the Consolidated Financial Statements for further discussion of net accumulated other
comprehensive income (loss) balance.
(2) Includes $33 million in net actuarial losses related to U.S. nonqualified pension plans.
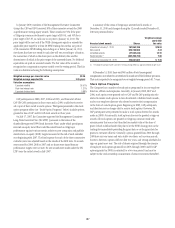
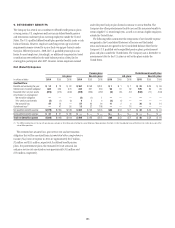
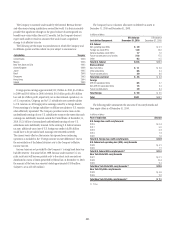
At the end of 2010 and 2009, for both qualified and nonqualified plans
and for both funded and unfunded plans, the aggregate projected benefit
obligation (PBO), the aggregate accumulated benefit obligation (ABO), and
the aggregate fair value of plan assets for pension plans with a projected
benefit obligation in excess of plan assets, and pension plans with an
accumulated benefit obligation in excess of plan assets, were as follows:
PBO exceeds fair value of plan
assets
ABO exceeds fair value of plan
assets
U.S. plans (1) Non-U.S. plans U.S. plans (1) Non-U.S. plans
In millions of dollars 2010 2009 2010 2009 2010 2009 2010 2009
Projected benefit obligation $12,388 $11,815 $2,305 $1,662 $12,388 $11,815 $1,549 $1,288
Accumulated benefit obligation 12,337 11,765 1,949 1,414 12,337 11,765 1,340 1,127
Fair value of plan assets 11,561 9,934 1,732 1,169 11,561 9,934 1,046 842
(1) In 2010, the PBO and ABO of the U.S. plans include $11,730 million and $11,689 million, respectively, relating to the qualified plan and $658 million and $648 million, respectively, relating to the nonqualified plans. In
2009, the PBO and ABO of the U.S. plans include $11,178 million and $11,129 million, respectively, relating to the qualified plan and $637 million and $636 million, respectively, relating to the nonqualified plans.
At December 31, 2010, combined accumulated benefit obligations for
the U.S. and non-U.S. pension plans, excluding U.S. nonqualified plans,
exceeded plan assets by $0.4 billion. At December 31, 2009, combined
accumulated benefit obligations for the U.S. and non-U.S. pension plans,
excluding U.S. nonqualified plans, exceeded plan assets by $0.5 billion.
Discount Rate
The discount rates for the U.S. pension and postretirement plans were selected
by reference to a Citigroup-specific analysis using each plan’s specific
cash flows and compared with high quality corporate bond indices for
reasonableness. Citigroup’s policy is to round to the nearest five hundredths
of a percent. Accordingly, at December 31, 2010, the discount rate was set
at 5.45% for the pension plans and at 5.10% for the postretirement welfare
plans.
At December 31, 2009, the discount rate was set at 5.90% for the pension
plans and 5.55% for the postretirement plans, referencing a Citigroup-specific
cash flow analysis.
The discount rates for the non-U.S. pension and postretirement plans are
selected by reference to high quality corporate bond rates in countries that
have developed corporate bond markets. However, where developed corporate
bond markets do not exist, the discount rates are selected by reference to local
government bond rates with a premium added to reflect the additional risk
for corporate bonds.
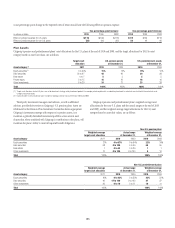
The discount rate and future rate of compensation assumptions used in
determining pension and postretirement benefit obligations and net benefit
expense for the Company’s plans are shown in the following table:
At year end 2010 2009
Discount rate
U.S. plans (1)
Pension 5.45% 5.90%
Postretirement 5.10 5.55
Non-U.S. pension plans
Range 1.75 to 14.00 2.00 to 13.25
Weighted average 6.23 6.50
Future compensation increase rate
U.S. plans (2) 3.00 3.00
Non-U.S. pension plans
Range 1.0 to 11.0 1.0 to 12.0
Weighted average 4.66 4.60
During the year 2010 2009
Discount rate
U.S. plans (1)
Pension 5.90% 6.10%
Postretirement 5.55 6.00
Non-U.S. pension plans
Range 2.00 to 13.25 1.75 to 17.0
Weighted average 6.50 6.60
Future compensation increase rate
U.S. plans (2) 3.00 3.00
Non-U.S. pension plans
Range 1.0 to 12.0 1.0 to 11.5
Weighted average 4.60 4.50
(1) Weighted-average rates for the U.S. plans equal the stated rates.
(2) Effective January 1, 2008, the U.S. qualified pension plan was frozen except for certain grandfathered
employees accruing benefits under a final pay plan formula. Only the future compensation increases
for these grandfathered employees will affect future pension expense and obligations. Future
compensation increase rates for small groups of employees were 4% or 6%.