Citibank 2010 Annual Report Download - page 219
Download and view the complete annual report
Please find page 219 of the 2010 Citibank annual report below. You can navigate through the pages in the report by either clicking on the pages listed below, or by using the keyword search tool below to find specific information within the annual report.-
 1
1 -
2
-
3
-
4
-
5
-
6
-
7
-
8
-
9
-
10
-
11
-
12
-
13
-
14
-
15
-
16
-
17
-
18
-
19
-
20
-
21
-
22
-
23
-
24
-
25
-
26
-
27
-
28
-
29
-
30
-
31
-
32
-
33
-
34
-
35
-
36
-
37
-
38
-
39
-
40
-
41
-
42
-
43
-
44
-
45
-
46
-
47
-
48
-
49
-
50
-
51
-
52
-
53
-
54
-
55
-
56
-
57
-
58
-
59
-
60
-
61
-
62
-
63
-
64
-
65
-
66
-
67
-
68
-
69
-
70
-
71
-
72
-
73
-
74
-
75
-
76
-
77
-
78
-
79
-
80
-
81
-
82
-
83
-
84
-
85
-
86
-
87
-
88
-
89
-
90
-
91
-
92
-
93
-
94
-
95
-
96
-
97
-
98
-
99
-
100
-
101
-
102
-
103
-
104
-
105
-
106
-
107
-
108
-
109
-
110
-
111
-
112
-
113
-
114
-
115
-
116
-
117
-
118
-
119
-
120
-
121
-
122
-
123
-
124
-
125
-
126
-
127
-
128
-
129
-
130
-
131
-
132
-
133
-
134
-
135
-
136
-
137
-
138
-
139
-
140
-
141
-
142
-
143
-
144
-
145
-
146
-
147
-
148
-
149
-
150
-
151
-
152
-
153
-
154
-
155
-
156
-
157
-
158
-
159
-
160
-
161
-
162
-
163
-
164
-
165
-
166
-
167
-
168
-
169
-
170
-
171
-
172
-
173
-
174
-
175
-
176
-
177
-
178
-
179
-
180
-
181
-
182
-
183
-
184
-
185
-
186
-
187
-
188
-
189
-
190
-
191
-
192
-
193
-
194
-
195
-
196
-
197
-
198
-
199
-
200
-
201
-
202
-
203
-
204
-
205
-
206
-
207
-
208
-
 209
209 -
 210
210 -
 211
211 -
 212
212 -
 213
213 -
 214
214 -
 215
215 -
 216
216 -
 217
217 -
 218
218 -
 219
219 -
 220
220 -
 221
221 -
 222
222 -
 223
223 -
 224
224 -
 225
225 -
 226
226 -
 227
227 -
 228
228 -
 229
229 -
230
-
231
-
232
-
233
-
234
-
235
-
236
-
237
-
238
-
239
-
240
-
241
-
242
-
243
-
244
-
245
-
246
-
247
-
248
-
249
-
250
-
251
-
252
-
253
-
254
-
255
-
256
-
257
-
258
-
259
-
260
-
261
-
262
-
263
-
264
-
265
-
266
-
267
-
268
-
269
-
270
-
271
-
272
-
273
-
274
-
275
-
276
-
277
-
278
-
279
-
280
-
281
-
282
-
283
-
284
-
285
-
286
-
287
-
288
-
289
-
290
-
291
-
292
-
293
-
294
-
295
-
296
-
297
-
298
-
299
-
300
-
301
-
302
-
303
-
304
-
305
-
306
-
307
-
308
-
309
-
310
-
311
-
312
 |
 |

217
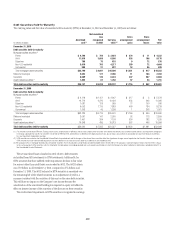
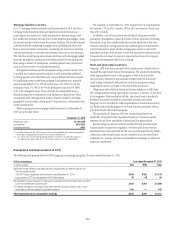
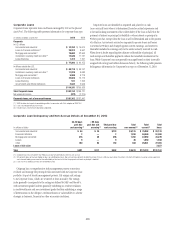
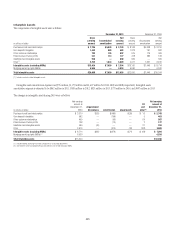
Residential Mortgage Loan to Values (LTVs)
Loan to value (LTV) ratios are important credit indicators for U.S. mortgage
loans. These ratios (loan balance divided by appraised value) are calculated
at origination and updated by applying market price data. The following
table provides details on the LTV ratios attributable to Citi’s U.S. mortgage
portfolios as of December 31, 2010. LTVs are updated monthly using the most
recent Core Logic HPI data available for substantially all of the portfolio
applied at the Metropolitan Statistical Area level, if available; otherwise at
the state level. The remainder of the portfolio is updated in a similar manner
using the Office of Federal Housing Enterprise Oversight indices.
LTV Distribution in U.S. Portfolio (1)(2) LTV
In millions of dollars
Less than or
equal to 80%
> 80% but less
than or equal
to 100%
Greater
than
100%
First mortgages $32,408 $25,311 $26,636
Home equity loans 12,698 10,940 20,670
Total $45,106 $36,251 $47,306
(1) Excludes loans guaranteed by U.S. government agencies, loans subject to LTSCs and loans recorded
at fair value.
(2) Excludes balances where LTV was not available. Such amounts are not material.
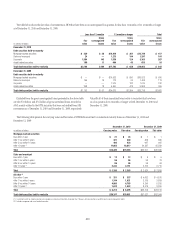
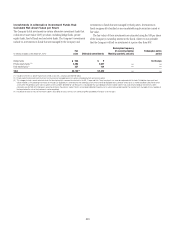
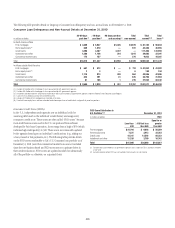
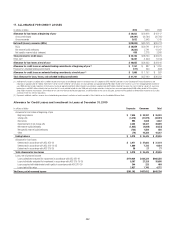
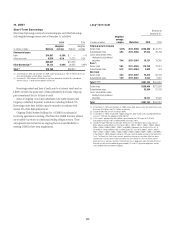
Impaired Consumer Loans
Impaired loans are those where Citigroup believes it is probable that it will
not collect all amounts due according to the original contractual terms
of the loan. Impaired Consumer loans include non-accrual commercial
market loans as well as smaller-balance homogeneous loans whose terms
have been modified due to the borrower’s financial difficulties and Citigroup
has granted a concession to the borrower. These modifications may include
interest rate reductions and/or principal forgiveness. Impaired Consumer
loans exclude smaller-balance homogeneous loans that have not been
modified and are carried on a non-accrual basis, as well as substantially all
loans modified pursuant to Citi’s short-term modification programs (i.e., for
periods of 12 months or less). At December 31, 2010, loans included in these
short-term programs amounted to $5.7 billion.
Valuation allowances for impaired Consumer loans are determined in
accordance with ASC 310-10-35 considering all available evidence including,
as appropriate, the present value of the expected future cash flows discounted
at the loan’s original contractual effective rate, the secondary market value of
the loan and the fair value of collateral less disposal costs.
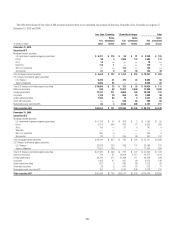
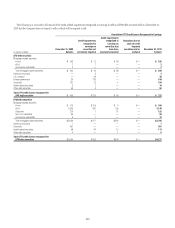
The following table presents information about total impaired Consumer loans at and for the periods ending December 31, 2010 and 2009, respectively:
Impaired Consumer Loans
At and for the period ended Dec. 31, 2010 Dec. 31, 2009
In millions of dollars
Recorded
investment (1)(2)
Principal
balance
Related specific
allowance (3)
Average
carrying value (4)
Interest income
recognized Recorded investment (1)
Mortgage and real estate $10,629
First mortgages $16,225 $17,287 $2,783 $13,606 $ 862
Home equity loans 1,205 1,256 393 1,010 40
Credit cards 5,906 5,906 3,237 5,314 131 2,453
Installment and other 3,853
Individual installment and other 3,286 3,348 1,172 3,627 393
Commercial market loans 706 934 145 909 26
Total (5) $27,328 $28,731 $ 7,730 $24,466 $ 1,452 $16,935
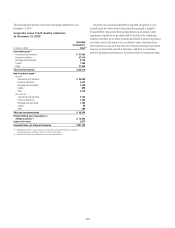
At and for the period ended
In millions of dollars
Dec. 31,
2009
Dec. 31,
2008
Average carrying value (4) $14,049 $5,266
Interest income recognized 792 276
(1) Recorded investment in a loan includes accrued credit card interest, and excludes net deferred loan
fees and costs, unamortized premium or discount and direct write-downs.
(2) $1,050 million of first mortgages, $6 million of home equity loans and $323 million of commercial
market loans do not have a specific allowance.
(3) Included in the Allowance for loan losses.
(4) Average carrying value does not include related specific allowance.
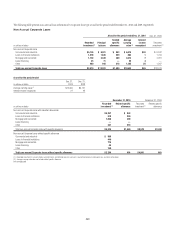
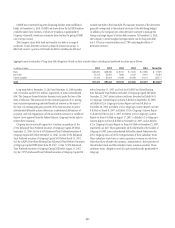
(5) Prior to 2008, the Company’s financial accounting systems did not separately track impaired smaller-
balance, homogeneous Consumer loans whose terms were modified due to the borrowers’ financial
difficulties and it was determined that a concession was granted to the borrower. Smaller-balance
Consumer loans modified since January 1, 2008 amounted to $26.6 billion and $15.9 billion at
December 31, 2010 and 2009, respectively. However, information derived from the Company’s risk
management systems indicates that the amounts of such outstanding modified loans, including those
modified prior to 2008, approximated $28.2 billion and $18.1 billion at December 31, 2010 and
2009, respectively.