Citibank 2010 Annual Report Download - page 36
Download and view the complete annual report
Please find page 36 of the 2010 Citibank annual report below. You can navigate through the pages in the report by either clicking on the pages listed below, or by using the keyword search tool below to find specific information within the annual report.-
 1
1 -
2
-
3
-
4
-
5
-
6
-
7
-
8
-
9
-
10
-
11
-
12
-
13
-
14
-
15
-
16
-
17
-
18
-
19
-
20
-
21
-
22
-
23
-
24
-
25
-
 26
26 -
 27
27 -
 28
28 -
 29
29 -
 30
30 -
 31
31 -
 32
32 -
 33
33 -
 34
34 -
 35
35 -
 36
36 -
 37
37 -
 38
38 -
 39
39 -
 40
40 -
 41
41 -
 42
42 -
 43
43 -
 44
44 -
 45
45 -
 46
46 -
47
-
48
-
49
-
50
-
51
-
52
-
53
-
54
-
55
-
56
-
57
-
58
-
59
-
60
-
61
-
62
-
63
-
64
-
65
-
66
-
67
-
68
-
69
-
70
-
71
-
72
-
73
-
74
-
75
-
76
-
77
-
78
-
79
-
80
-
81
-
82
-
83
-
84
-
85
-
86
-
87
-
88
-
89
-
90
-
91
-
92
-
93
-
94
-
95
-
96
-
97
-
98
-
99
-
100
-
101
-
102
-
103
-
104
-
105
-
106
-
107
-
108
-
109
-
110
-
111
-
112
-
113
-
114
-
115
-
116
-
117
-
118
-
119
-
120
-
121
-
122
-
123
-
124
-
125
-
126
-
127
-
128
-
129
-
130
-
131
-
132
-
133
-
134
-
135
-
136
-
137
-
138
-
139
-
140
-
141
-
142
-
143
-
144
-
145
-
146
-
147
-
148
-
149
-
150
-
151
-
152
-
153
-
154
-
155
-
156
-
157
-
158
-
159
-
160
-
161
-
162
-
163
-
164
-
165
-
166
-
167
-
168
-
169
-
170
-
171
-
172
-
173
-
174
-
175
-
176
-
177
-
178
-
179
-
180
-
181
-
182
-
183
-
184
-
185
-
186
-
187
-
188
-
189
-
190
-
191
-
192
-
193
-
194
-
195
-
196
-
197
-
198
-
199
-
200
-
201
-
202
-
203
-
204
-
205
-
206
-
207
-
208
-
209
-
210
-
211
-
212
-
213
-
214
-
215
-
216
-
217
-
218
-
219
-
220
-
221
-
222
-
223
-
224
-
225
-
226
-
227
-
228
-
229
-
230
-
231
-
232
-
233
-
234
-
235
-
236
-
237
-
238
-
239
-
240
-
241
-
242
-
243
-
244
-
245
-
246
-
247
-
248
-
249
-
250
-
251
-
252
-
253
-
254
-
255
-
256
-
257
-
258
-
259
-
260
-
261
-
262
-
263
-
264
-
265
-
266
-
267
-
268
-
269
-
270
-
271
-
272
-
273
-
274
-
275
-
276
-
277
-
278
-
279
-
280
-
281
-
282
-
283
-
284
-
285
-
286
-
287
-
288
-
289
-
290
-
291
-
292
-
293
-
294
-
295
-
296
-
297
-
298
-
299
-
300
-
301
-
302
-
303
-
304
-
305
-
306
-
307
-
308
-
309
-
310
-
311
-
312
 |
 |

34
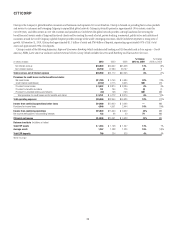
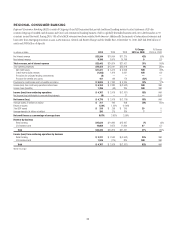
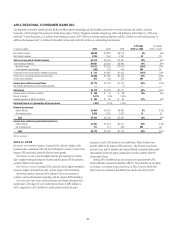
NORTH AMERICA REGIONAL CONSUMER BANKING
North America Regional Consumer Banking (NA RCB) provides traditional banking and Citi-branded card services to retail customers and small to mid-size
businesses in the U.S. NA RCB’s approximate 1,000 retail bank branches and 13.1 million retail customer accounts are largely concentrated in the greater
metropolitan areas of New York, Los Angeles, San Francisco, Chicago, Miami, Washington, D.C., Boston, Philadelphia, and certain larger cities in Texas. At
December 31, 2010, NA RCB had $30.7 billion of retail banking and residential real estate loans and $144.8 billion of average deposits. In addition, NA RCB
had 21.2 million Citi-branded credit card accounts, with $77.5 billion in outstanding card loan balances.
In millions of dollars 2010 2009 2008
% Change
2010 vs. 2009
% Change
2009 vs. 2008
Net interest revenue $11,216 $ 5,204 $ 4,332 NM 20%
Non-interest revenue 3,574 3,372 4,275 6% (21)
Total revenues, net of interest expense $14,790 $ 8,576 $ 8,607 72% —
Total operating expenses $ 6,224 $ 5,987 $ 9,105 4% (34)%
Net credit losses $ 8,022 $ 1,151 $ 617 NM 87%
Credit reserve build (release) (313) 527 465 NM 13
Provisions for benefits and claims 24 50 4 (52)% NM
Provisions for loan losses and for benefits and claims $ 7,733 $ 1,728 $ 1,086 NM 59%
Income (loss) from continuing operations before taxes $ 833 861 $(1,584) (3)% NM
Income taxes (benefits) 226 131 (80) 73 NM
Income (loss) from continuing operations $ 607 $ 730 $(1,504) (17)% NM
Net income attributable to noncontrolling interests —— — ——
Net income (loss) $ 607 $ 730 $ (1,504) (17)% NM
Average assets (in billions of dollars) $ 119 $ 73 $ 75 63% (3)%
Average deposits (in billions of dollars) $ 145 $ 140 $ 125 4% 12%
Net credit losses as a percentage of average loans 7.48% 2.43% 1.39%
Revenue by business
Retail banking $ 5,325 $ 5,237 $ 4,613 2% 14%
Citi-branded cards 9,465 3,339 3,994 NM (16)
Total $14,790 $ 8,576 $ 8,607 72% —
Income (loss) from continuing operations by business
Retail banking $ 771 $ 805 $(1,714) (4)% NM
Citi-branded cards (164) (75) 210 NM NM
Total $ 607 $ 730 $ (1,504) (17)% NM
NM Not meaningful
2010 vs. 2009
Revenues, net of interest expense increased 72% from the prior year,
primarily due to the consolidation of securitized credit card receivables
pursuant to the adoption of SFAS 166/167 effective January 1, 2010. On a
comparable basis, Revenues, net of interest expense, declined 3% from the
prior year, mainly due to lower volumes in branded cards as well as the net
impact of the Credit Card Accountability Responsibility and Disclosure Act
of 2009 (CARD Act) on cards revenues. This decrease was partially offset by
better mortgage-related revenues.
Net interest revenue was down 6% on a comparable basis driven
primarily by lower volumes in cards, with average managed loans down 7%
from the prior year, and in retail banking, where average loans declined 11%.
The increase in deposit volumes, up 4% from the prior year, was offset by
lower spreads in the current interest rate environment.
Non-interest revenue increased 9% on a comparable basis from the prior
year mainly driven by better servicing hedge results and higher gains from
loan sales in mortgages.
Operating expenses increased 4% from the prior year, driven by the impact
of litigation reserves in the first quarter of 2010 and higher marketing costs.
Provisions for loan losses and for benefits and claims increased
$6.0 billion primarily due to the consolidation of securitized credit card
receivables pursuant to the adoption of SFAS 166/167. On a comparable
basis, Provisions for loan losses and for benefits and claims decreased
$0.9 billion, or 11%, primarily due to a net loan loss reserve release of
$0.3 billion in 2010 compared to a $0.5 billion loan loss reserve build in the
prior year, and lower net credit losses in the branded cards portfolio. Also on
a comparable basis, the cards net credit loss ratio increased 61 basis points to
10.02%, driven by lower average loans.