Citibank 2010 Annual Report Download - page 29
Download and view the complete annual report
Please find page 29 of the 2010 Citibank annual report below. You can navigate through the pages in the report by either clicking on the pages listed below, or by using the keyword search tool below to find specific information within the annual report.-
 1
1 -
2
-
3
-
4
-
5
-
6
-
7
-
8
-
9
-
10
-
11
-
12
-
13
-
14
-
15
-
16
-
17
-
18
-
 19
19 -
 20
20 -
 21
21 -
 22
22 -
 23
23 -
 24
24 -
 25
25 -
 26
26 -
 27
27 -
 28
28 -
 29
29 -
 30
30 -
 31
31 -
 32
32 -
 33
33 -
 34
34 -
 35
35 -
 36
36 -
 37
37 -
 38
38 -
 39
39 -
40
-
41
-
42
-
43
-
44
-
45
-
46
-
47
-
48
-
49
-
50
-
51
-
52
-
53
-
54
-
55
-
56
-
57
-
58
-
59
-
60
-
61
-
62
-
63
-
64
-
65
-
66
-
67
-
68
-
69
-
70
-
71
-
72
-
73
-
74
-
75
-
76
-
77
-
78
-
79
-
80
-
81
-
82
-
83
-
84
-
85
-
86
-
87
-
88
-
89
-
90
-
91
-
92
-
93
-
94
-
95
-
96
-
97
-
98
-
99
-
100
-
101
-
102
-
103
-
104
-
105
-
106
-
107
-
108
-
109
-
110
-
111
-
112
-
113
-
114
-
115
-
116
-
117
-
118
-
119
-
120
-
121
-
122
-
123
-
124
-
125
-
126
-
127
-
128
-
129
-
130
-
131
-
132
-
133
-
134
-
135
-
136
-
137
-
138
-
139
-
140
-
141
-
142
-
143
-
144
-
145
-
146
-
147
-
148
-
149
-
150
-
151
-
152
-
153
-
154
-
155
-
156
-
157
-
158
-
159
-
160
-
161
-
162
-
163
-
164
-
165
-
166
-
167
-
168
-
169
-
170
-
171
-
172
-
173
-
174
-
175
-
176
-
177
-
178
-
179
-
180
-
181
-
182
-
183
-
184
-
185
-
186
-
187
-
188
-
189
-
190
-
191
-
192
-
193
-
194
-
195
-
196
-
197
-
198
-
199
-
200
-
201
-
202
-
203
-
204
-
205
-
206
-
207
-
208
-
209
-
210
-
211
-
212
-
213
-
214
-
215
-
216
-
217
-
218
-
219
-
220
-
221
-
222
-
223
-
224
-
225
-
226
-
227
-
228
-
229
-
230
-
231
-
232
-
233
-
234
-
235
-
236
-
237
-
238
-
239
-
240
-
241
-
242
-
243
-
244
-
245
-
246
-
247
-
248
-
249
-
250
-
251
-
252
-
253
-
254
-
255
-
256
-
257
-
258
-
259
-
260
-
261
-
262
-
263
-
264
-
265
-
266
-
267
-
268
-
269
-
270
-
271
-
272
-
273
-
274
-
275
-
276
-
277
-
278
-
279
-
280
-
281
-
282
-
283
-
284
-
285
-
286
-
287
-
288
-
289
-
290
-
291
-
292
-
293
-
294
-
295
-
296
-
297
-
298
-
299
-
300
-
301
-
302
-
303
-
304
-
305
-
306
-
307
-
308
-
309
-
310
-
311
-
312
 |
 |
27
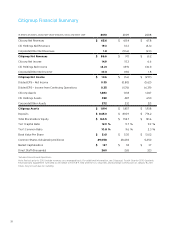
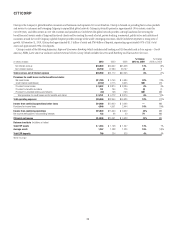
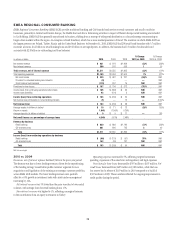
Operating Expenses
Citigroup operating expenses were down 1% versus the prior year at
$47.4 billion in 2010, as increased investment spending, FX translation, and
inflation in Citicorp were more than offset by lower expenses in Citi Holdings.
In Citicorp, expenses increased 10% year over year to $35.9 billion, mainly
due to higher investment spending across all Citicorp businesses as well
as FX translation and inflation. In Citi Holdings, operating expenses were
down 31% year over year to $9.6 billion, reflecting the continued reduction
of assets.
Capital and Loan Loss Reserve Positions
Citi increased its Tier 1 Common and Tier 1 Capital ratios during 2010. At
December 31, 2010, Citi’s Tier 1 Common ratio was 10.8% and its Tier 1
Capital ratio was 12.9%, compared to 9.6% and 11.7% at December 31, 2009,
respectively. Tier 1 Common was relatively flat year over year at $105 billion,
even after absorbing a $14.2 billion reduction from the impact of SFAS
166/167 in the first quarter, while total risk-weighted assets declined 10% to
$978 billion.
Citigroup ended the year with a total allowance for loan losses of
$40.7 billion, up $4.6 billion, or 13%, from the prior year, reflecting the
impact of adopting SFAS 166/167 which added $13.4 billion on January
1, 2010. The allowance represented 6.31% of total loans and 209% of
non-accrual loans as of December 31, 2010, up from 6.09% and 114%,
respectively, at the end of 2009. The consumer loan loss reserve was
$35.4 billion at December 31, 2010, representing 7.77% of total loans, versus
$28.4 billion, or 6.70%, at December 31, 2009.
Liquidity and Funding
Citigroup maintained a high level of liquidity, with aggregate liquidity
resources (including cash at major central banks and unencumbered liquid
securities) of $322 billion at year-end 2010, up from $316 billion at year-end
2009. Citi also continued to grow its deposit base, closing 2010 with $845
billion in deposits, up 1% from year-end 2009. Structural liquidity (defined as
deposits, long-term debt and equity as a percentage of total assets) remained
strong at 73% as of December 31, 2010, flat compared to December 31, 2009,
and up from 66% at December 31, 2008.
Citigroup issued approximately $22 billion (excluding local country and
securitizations) of long-term debt in 2010, representing just over half of its
2010 long-term maturities, due to its strong liquidity position and proceeds
received from asset reductions in Citi Holdings. For additional information,
see “Capital Resources and Liquidity—Funding and Liquidity” below.
2011 Business Outlook
In 2011, management will continue its focus on growing and investing in
the core Citicorp franchise, while economically rationalizing Citi Holdings.
However, Citigroup’s results will continue to be affected by factors outside
of its control, such as the global economic and regulatory environment
in the regions in which Citi operates. In particular, the macroeconomic
environment in the U.S. remains challenging, with unemployment levels
still elevated and continued pressure and uncertainty in the housing market,
including home prices. Additionally, the continued implementation of
the Dodd-Frank Wall Street Reform and Consumer Protection Act of 2010
(Financial Reform Act), including the ongoing extensive rulemaking and
interpretive issues, as well as the new capital standards for bank holding
companies as adopted by the Basel Committee on Banking Supervision
(Basel Committee) and U.S. regulators, will remain a significant source
of uncertainty in 2011. Moreover, the implementation of the change in
methodology for calculating FDIC insurance premiums, to be effective in
the second quarter 2011, will have a negative impact on Citi’s earnings.
(For additional information on these factors, see “Capital Resources and
Liquidity” and “Risk Factors” below.)
In Citicorp, Securities and Banking results for 2011 will depend on the
level of client activity and on macroeconomic conditions, market valuations
and volatility, interest rates and other market factors. Transaction Services
business performance will also continue to be impacted by macroeconomic
conditions as well as market factors, including interest rate levels, global
economic and trade activity, volatility in capital markets, foreign exchange
and market valuations.
In Regional Consumer Banking, results during the year are likely to
be driven by different trends in North America versus the international
regions. In North America, if economic recovery is sustained, revenues could
grow modestly, particularly in the second half of the year, assuming loan
demand begins to recover. However, net credit margin in North America will
likely continue to be driven primarily by improvement in net credit losses.
Internationally, given continued economic expansion in these regions, net
credit margin is likely to be driven by revenue growth, particularly in the
second half of the year, as investment spending should continue to generate
volume growth to outpace spread compression. International credit costs are
likely to increase in 2011, reflecting a growing loan portfolio.
In Citi Holdings, revenues for Local Consumer Lending should continue
to decline reflecting a shrinking loan balance resulting from paydowns and
asset sales. Based on current delinquency trends and ongoing loss-mitigation
actions, credit costs are expected to continue to improve. Overall, however,
Local Consumer Lending will likely continue to drive results in Citi Holdings.
Operating expenses are expected to show some variability across quarters
as the Company continues to invest in Citicorp while rationalizing Citi
Holdings and maintaining expense discipline. Although Citi currently
expects net interest margin (NIM) to remain under pressure during the
first quarter of 2011, driven by continued low yields on investments and the
run-off of higher yielding loan assets, NIM could begin to stabilize during the
remainder of the year.