Citibank 2010 Annual Report Download - page 294
Download and view the complete annual report
Please find page 294 of the 2010 Citibank annual report below. You can navigate through the pages in the report by either clicking on the pages listed below, or by using the keyword search tool below to find specific information within the annual report.-
 1
1 -
2
-
3
-
4
-
5
-
6
-
7
-
8
-
9
-
10
-
11
-
12
-
13
-
14
-
15
-
16
-
17
-
18
-
19
-
20
-
21
-
22
-
23
-
24
-
25
-
26
-
27
-
28
-
29
-
30
-
31
-
32
-
33
-
34
-
35
-
36
-
37
-
38
-
39
-
40
-
41
-
42
-
43
-
44
-
45
-
46
-
47
-
48
-
49
-
50
-
51
-
52
-
53
-
54
-
55
-
56
-
57
-
58
-
59
-
60
-
61
-
62
-
63
-
64
-
65
-
66
-
67
-
68
-
69
-
70
-
71
-
72
-
73
-
74
-
75
-
76
-
77
-
78
-
79
-
80
-
81
-
82
-
83
-
84
-
85
-
86
-
87
-
88
-
89
-
90
-
91
-
92
-
93
-
94
-
95
-
96
-
97
-
98
-
99
-
100
-
101
-
102
-
103
-
104
-
105
-
106
-
107
-
108
-
109
-
110
-
111
-
112
-
113
-
114
-
115
-
116
-
117
-
118
-
119
-
120
-
121
-
122
-
123
-
124
-
125
-
126
-
127
-
128
-
129
-
130
-
131
-
132
-
133
-
134
-
135
-
136
-
137
-
138
-
139
-
140
-
141
-
142
-
143
-
144
-
145
-
146
-
147
-
148
-
149
-
150
-
151
-
152
-
153
-
154
-
155
-
156
-
157
-
158
-
159
-
160
-
161
-
162
-
163
-
164
-
165
-
166
-
167
-
168
-
169
-
170
-
171
-
172
-
173
-
174
-
175
-
176
-
177
-
178
-
179
-
180
-
181
-
182
-
183
-
184
-
185
-
186
-
187
-
188
-
189
-
190
-
191
-
192
-
193
-
194
-
195
-
196
-
197
-
198
-
199
-
200
-
201
-
202
-
203
-
204
-
205
-
206
-
207
-
208
-
209
-
210
-
211
-
212
-
213
-
214
-
215
-
216
-
217
-
218
-
219
-
220
-
221
-
222
-
223
-
224
-
225
-
226
-
227
-
228
-
229
-
230
-
231
-
232
-
233
-
234
-
235
-
236
-
237
-
238
-
239
-
240
-
241
-
242
-
243
-
244
-
245
-
246
-
247
-
248
-
249
-
250
-
251
-
252
-
253
-
254
-
255
-
256
-
257
-
258
-
259
-
260
-
261
-
262
-
263
-
264
-
265
-
266
-
267
-
268
-
269
-
270
-
271
-
272
-
273
-
274
-
275
-
276
-
277
-
278
-
279
-
280
-
281
-
282
-
283
-
 284
284 -
 285
285 -
 286
286 -
 287
287 -
 288
288 -
 289
289 -
 290
290 -
 291
291 -
 292
292 -
 293
293 -
 294
294 -
 295
295 -
 296
296 -
 297
297 -
 298
298 -
 299
299 -
 300
300 -
 301
301 -
 302
302 -
 303
303 -
 304
304 -
305
-
306
-
307
-
308
-
309
-
310
-
311
-
312
 |
 |

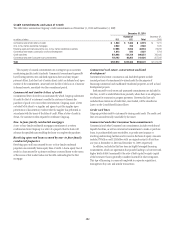
292
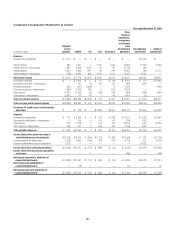
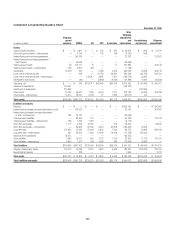
Condensed Consolidating Statements of Income
Year ended December 31, 2009
In millions of dollars
Citigroup
parent
company CGMHI CFI CCC Associates
Other
Citigroup
subsidiaries,
eliminations
and income
from
discontinued
operations
Consolidating
adjustments
Citigroup
consolidated
Revenues
Dividends from subsidiaries $ 1,049 $ — $ — $ — $ — $ — $(1,049) $ —
Interest revenue 299 7,447 1 6,150 7,049 61,839 (6,150) 76,635
Interest revenue—intercompany 2,387 2,806 4,132 69 421 (9,746) (69) —
Interest expense 9,354 2,585 1,911 86 376 13,495 (86) 27,721
Interest expense—intercompany (758) 2,390 823 2,243 1,572 (4,027) (2,243) —
Net interest revenue $ (5,910) $ 5,278 $ 1,399 $ 3,890 $5,522 $ 42,625 $(3,890) $48,914
Commissions and fees $ — $ 5,945 $ — $ 51 $ 128 $ 9,412 $ (51) $15,485
Commissions and fees—intercompany — 741 (6) 134 152 (887) (134) —
Principal transactions 359 (267) (1,905) — 2 7,879 — 6,068
Principal transactions—intercompany (649) 3,605 224 — (109) (3,071) — —
Other income (3,731) 13,586 38 428 584 (659) (428) 9,818
Other income—intercompany (3,663) (21) (47) 2 44 3,687 (2) —
Total non-interest revenues $ (7,684) $23,589 $(1,696) $ 615 $ 801 $ 16,361 $ (615) $31,371
Total revenues, net of interest expense $(12,545) $28,867 $ (297) $ 4,505 $6,323 $ 58,986 $(5,554) $80,285
Provisions for credit losses and for benefits
and claims $ — $ 129 $ — $ 3,894 $4,354 $ 35,779 $(3,894) $40,262
Expenses
Compensation and benefits $ 101 $ 6,389 $ — $ 523 $ 686 $ 17,811 $ (523) $24,987
Compensation and benefits—intercompany 7 470 — 141 141 (618) (141) —
Other expense 791 2,739 2 578 735 18,568 (578) 22,835
Other expense—intercompany 782 637 4 526 573 (1,996) (526) —
Total operating expenses $ 1,681 $10,235 $ 6 $ 1,768 $2,135 $ 33,765 $(1,768) $47,822
Income (loss) before taxes and equity in
undistributed income of subsidiaries $(14,226) $18,503 $ (303) $(1,157) $ (166) $(10,558) $ 108 $ (7,799)
Provision (benefit) for income taxes (7,298) 6,852 (146) (473) (131) (6,010) 473 (6,733)
Equity in undistributed income of subsidiaries 5,322 — — — — — (5,322) —
Income (loss) from continuing operations $ (1,606) $11,651 $ (157) $ (684) $ (35) $ (4,548) $(5,687) $ (1,066)
Income (loss) from discontinued operations,
net of taxes —— — — — (445) — (445)
Net income (loss) before attribution of
noncontrolling interests $ (1,606) $11,651 $ (157) $ (684) $ (35) $ (4,993) $(5,687) $ (1,511)
Net income (loss) attributable to
noncontrolling interests — (18) — — — 113 — 95
Net income (loss) after attribution of
noncontrolling interests $ (1,606) $11,669 $ (157) $ (684) $ (35) $ (5,106) $(5,687) $ (1,606)