Citibank 2012 Annual Report Download - page 97
Download and view the complete annual report
Please find page 97 of the 2012 Citibank annual report below. You can navigate through the pages in the report by either clicking on the pages listed below, or by using the keyword search tool below to find specific information within the annual report.-
 1
1 -
2
-
3
-
4
-
5
-
6
-
7
-
8
-
9
-
10
-
11
-
12
-
13
-
14
-
15
-
16
-
17
-
18
-
19
-
20
-
21
-
22
-
23
-
24
-
25
-
26
-
27
-
28
-
29
-
30
-
31
-
32
-
33
-
34
-
35
-
36
-
37
-
38
-
39
-
40
-
41
-
42
-
43
-
44
-
45
-
46
-
47
-
48
-
49
-
50
-
51
-
52
-
53
-
54
-
55
-
56
-
57
-
58
-
59
-
60
-
61
-
62
-
63
-
64
-
65
-
66
-
67
-
68
-
69
-
70
-
71
-
72
-
73
-
74
-
75
-
76
-
77
-
78
-
79
-
80
-
81
-
82
-
83
-
84
-
85
-
86
-
 87
87 -
 88
88 -
 89
89 -
 90
90 -
 91
91 -
 92
92 -
 93
93 -
 94
94 -
 95
95 -
 96
96 -
 97
97 -
 98
98 -
 99
99 -
 100
100 -
 101
101 -
 102
102 -
 103
103 -
 104
104 -
 105
105 -
 106
106 -
 107
107 -
108
-
109
-
110
-
111
-
112
-
113
-
114
-
115
-
116
-
117
-
118
-
119
-
120
-
121
-
122
-
123
-
124
-
125
-
126
-
127
-
128
-
129
-
130
-
131
-
132
-
133
-
134
-
135
-
136
-
137
-
138
-
139
-
140
-
141
-
142
-
143
-
144
-
145
-
146
-
147
-
148
-
149
-
150
-
151
-
152
-
153
-
154
-
155
-
156
-
157
-
158
-
159
-
160
-
161
-
162
-
163
-
164
-
165
-
166
-
167
-
168
-
169
-
170
-
171
-
172
-
173
-
174
-
175
-
176
-
177
-
178
-
179
-
180
-
181
-
182
-
183
-
184
-
185
-
186
-
187
-
188
-
189
-
190
-
191
-
192
-
193
-
194
-
195
-
196
-
197
-
198
-
199
-
200
-
201
-
202
-
203
-
204
-
205
-
206
-
207
-
208
-
209
-
210
-
211
-
212
-
213
-
214
-
215
-
216
-
217
-
218
-
219
-
220
-
221
-
222
-
223
-
224
-
225
-
226
-
227
-
228
-
229
-
230
-
231
-
232
-
233
-
234
-
235
-
236
-
237
-
238
-
239
-
240
-
241
-
242
-
243
-
244
-
245
-
246
-
247
-
248
-
249
-
250
-
251
-
252
-
253
-
254
-
255
-
256
-
257
-
258
-
259
-
260
-
261
-
262
-
263
-
264
-
265
-
266
-
267
-
268
-
269
-
270
-
271
-
272
-
273
-
274
-
275
-
276
-
277
-
278
-
279
-
280
-
281
-
282
-
283
-
284
-
285
-
286
-
287
-
288
-
289
-
290
-
291
-
292
-
293
-
294
-
295
-
296
-
297
-
298
-
299
-
300
-
301
-
302
-
303
-
304
-
305
-
306
-
307
-
308
-
309
-
310
-
311
-
312
-
313
-
314
-
315
-
316
-
317
-
318
-
319
-
320
-
321
-
322
-
323
-
324
 |
 |

75
CREDIT RISK
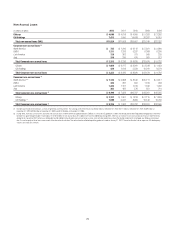
Loans Outstanding
In millions of dollars 2012 2011 2010 2009 2008
Consumer loans
In U.S. offices
Mortgage and real estate (1) $125,946 $139,177 $151,469 $183,842 $219,482
Installment, revolving credit, and other 14,070 15,616 28,291 58,099 64,319
Cards (2) 111,403 117,908 122,384 28,951 44,418
Commercial and industrial 5,344 4,766 5,021 5,640 7,041
Lease financing —1 2 11 31
$256,763 $277,468 $307,167 $276,543 $335,291
In offices outside the U.S.
Mortgage and real estate (1) $ 54,709 $ 52,052 $ 52,175 $ 47,297 $ 44,382
Installment, revolving credit, and other 36,182 34,613 38,024 42,805 41,272
Cards 40,653 38,926 40,948 41,493 42,586
Commercial and industrial 20,001 19,975 16,136 14,183 16,814
Lease financing 781 711 665 331 304
$152,326 $146,277 $147,948 $146,109 $145,358
Total Consumer loans $409,089 $423,745 $455,115 $422,652 $480,649
Unearned income (418) (405) 69 808 738
Consumer loans, net of unearned income $408,671 $423,340 $455,184 $423,460 $481,387
Corporate loans
In U.S. offices
Commercial and industrial $ 26,985 $ 20,830 $ 13,669 $ 15,614 $ 26,447
Loans to financial institutions (2) 18,159 15,113 8,995 6,947 10,200
Mortgage and real estate (1) 24,705 21,516 19,770 22,560 28,043
Installment, revolving credit, and other 32,446 33,182 34,046 17,737 22,050
Lease financing 1,410 1,270 1,413 1,297 1,476
$103,705 $ 91,911 $ 77,893 $ 64,155 $ 88,216
In offices outside the U.S.
Commercial and industrial $ 82,939 $ 79,764 $ 72,166 $ 67,344 $ 79,421
Installment, revolving credit, and other 14,958 14,114 11,829 9,683 17,441
Mortgage and real estate (1) 6,485 6,885 5,899 9,779 11,375
Loans to financial institutions 37,739 29,794 22,620 15,113 18,413
Lease financing 605 568 531 1,295 1,850
Governments and official institutions 1,159 1,576 3,644 2,949 773
$143,885 $132,701 $116,689 $106,163 $129,273
Total Corporate loans $247,590 $224,612 $194,582 $170,318 $217,489
Unearned income (797) (710) (972) (2,274) (4,660)
Corporate loans, net of unearned income $246,793 $223,902 $193,610 $168,044 $212,829
Total loans—net of unearned income $655,464 $647,242 $648,794 $591,504 $694,216
Allowance for loan losses—on drawn exposures (25,455) (30,115) (40,655) (36,033) (29,616)
Total loans—net of unearned income and allowance for credit losses $630,009 $617,127 $608,139 $555,471 $664,600
Allowance for loan losses as a percentage of total loans—net of
unearned income (3) 3.92% 4.69% 6.31% 6.09% 4.27%
Allowance for Consumer loan losses as a percentage of total Consumer
loans—net of unearned income (3) 5.57% 6.45% 7.81% 6.69% 4.61%
Allowance for Corporate loan losses as a percentage of total Corporate
loans—net of unearned income (3) 1.14% 1.31% 2.75% 4.57% 3.48%
(1) Loans secured primarily by real estate.
(2) Beginning in 2010, includes the impact of consolidating entities in connection with Citi’s adoption of SFAS 167.
(3) Excludes loans in 2012, 2011 and 2010 that are carried at fair value.