Citibank 2012 Annual Report Download - page 277
Download and view the complete annual report
Please find page 277 of the 2012 Citibank annual report below. You can navigate through the pages in the report by either clicking on the pages listed below, or by using the keyword search tool below to find specific information within the annual report.-
 1
1 -
2
-
3
-
4
-
5
-
6
-
7
-
8
-
9
-
10
-
11
-
12
-
13
-
14
-
15
-
16
-
17
-
18
-
19
-
20
-
21
-
22
-
23
-
24
-
25
-
26
-
27
-
28
-
29
-
30
-
31
-
32
-
33
-
34
-
35
-
36
-
37
-
38
-
39
-
40
-
41
-
42
-
43
-
44
-
45
-
46
-
47
-
48
-
49
-
50
-
51
-
52
-
53
-
54
-
55
-
56
-
57
-
58
-
59
-
60
-
61
-
62
-
63
-
64
-
65
-
66
-
67
-
68
-
69
-
70
-
71
-
72
-
73
-
74
-
75
-
76
-
77
-
78
-
79
-
80
-
81
-
82
-
83
-
84
-
85
-
86
-
87
-
88
-
89
-
90
-
91
-
92
-
93
-
94
-
95
-
96
-
97
-
98
-
99
-
100
-
101
-
102
-
103
-
104
-
105
-
106
-
107
-
108
-
109
-
110
-
111
-
112
-
113
-
114
-
115
-
116
-
117
-
118
-
119
-
120
-
121
-
122
-
123
-
124
-
125
-
126
-
127
-
128
-
129
-
130
-
131
-
132
-
133
-
134
-
135
-
136
-
137
-
138
-
139
-
140
-
141
-
142
-
143
-
144
-
145
-
146
-
147
-
148
-
149
-
150
-
151
-
152
-
153
-
154
-
155
-
156
-
157
-
158
-
159
-
160
-
161
-
162
-
163
-
164
-
165
-
166
-
167
-
168
-
169
-
170
-
171
-
172
-
173
-
174
-
175
-
176
-
177
-
178
-
179
-
180
-
181
-
182
-
183
-
184
-
185
-
186
-
187
-
188
-
189
-
190
-
191
-
192
-
193
-
194
-
195
-
196
-
197
-
198
-
199
-
200
-
201
-
202
-
203
-
204
-
205
-
206
-
207
-
208
-
209
-
210
-
211
-
212
-
213
-
214
-
215
-
216
-
217
-
218
-
219
-
220
-
221
-
222
-
223
-
224
-
225
-
226
-
227
-
228
-
229
-
230
-
231
-
232
-
233
-
234
-
235
-
236
-
237
-
238
-
239
-
240
-
241
-
242
-
243
-
244
-
245
-
246
-
247
-
248
-
249
-
250
-
251
-
252
-
253
-
254
-
255
-
256
-
257
-
258
-
259
-
260
-
261
-
262
-
263
-
264
-
265
-
266
-
 267
267 -
 268
268 -
 269
269 -
 270
270 -
 271
271 -
 272
272 -
 273
273 -
 274
274 -
 275
275 -
 276
276 -
 277
277 -
 278
278 -
 279
279 -
 280
280 -
 281
281 -
 282
282 -
 283
283 -
 284
284 -
 285
285 -
 286
286 -
 287
287 -
288
-
289
-
290
-
291
-
292
-
293
-
294
-
295
-
296
-
297
-
298
-
299
-
300
-
301
-
302
-
303
-
304
-
305
-
306
-
307
-
308
-
309
-
310
-
311
-
312
-
313
-
314
-
315
-
316
-
317
-
318
-
319
-
320
-
321
-
322
-
323
-
324
 |
 |

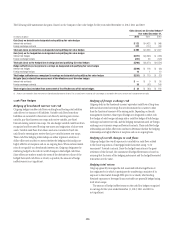
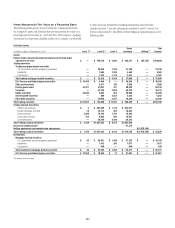
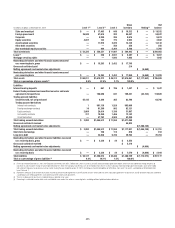
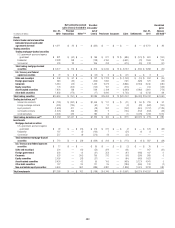
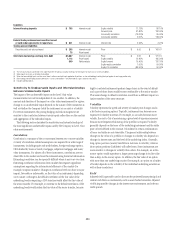
255
In millions of dollars at December 31, 2012 Level 1 (1) Level 2 (1) Level 3
Gross
inventory Netting (2)
Net
balance
State and municipal $ — $ 17,483 $ 849 $ 18,332 $ — $ 18,332
Foreign government 36,048 57,616 383 94,047 — 94,047
Corporate — 9,289 385 9,674 — 9,674
Equity securities 4,037 132 773 4,942 — 4,942
Asset-backed securities — 11,910 2,220 14,130 — 14,130
Other debt securities — — 258 258 — 258
Non-marketable equity securities — 404 5,364 5,768 — 5,768
Total investments $ 53,335 $ 229,221 $ 11,907 $ 294,463 $ — $294,463
Loans (3) $ — $ 356 $ 4,931 $ 5,287 $ — $ 5,287
Mortgage servicing rights — — 1,942 1,942 — 1,942
Nontrading derivatives and other financial assets measured
on a recurring basis, gross $ — $ 15,293 $ 2,452 $ 17,745
Gross cash collateral paid 214
Netting agreements and market value adjustments $ (4,660)
Nontrading derivatives and other financial assets measured
on a recurring basis $ — $ 15,293 $ 2,452 $ 17,959 $ (4,660) $ 13,299
Total assets $184,011 $1,619,372 $ 49,312 $1,914,061 $(1,117,552) $796,509
Total as a percentage of gross assets (4) 9.9% 87.4% 2.7% 100.0%
Liabilities
Interest-bearing deposits $ — $ 661 $ 786 $ 1,447 $ — $ 1,447
Federal funds purchased and securities loaned or sold under
agreements to repurchase — 158,580 841 159,421 (42,732) 116,689
Trading account liabilities
Securities sold, not yet purchased 55,145 8,288 365 63,798 63,798
Trading account derivatives
Interest rate contracts 1 891,138 1,529 892,668
Foreign exchange contracts 10 81,209 902 82,121
Equity contracts 2,664 26,014 3,189 31,867
Commodity contracts 317 10,359 1,466 12,142
Credit derivatives — 47,792 4,508 52,300
Total trading account derivatives $ 2,992 $1,056,512 $ 11,594 $1,071,098
Gross cash collateral received 46,833
Netting agreements and market value adjustments $(1,066,180)
Total trading account derivatives $ 2,992 $1,056,512 $ 11,594 $1,117,931 $(1,066,180) $ 51,751
Short-term borrowings — 706 112 818 — 818
Long-term debt — 23,038 6,726 29,764 — 29,764
Nontrading derivatives and other financial liabilities measured
on a recurring basis, gross $ — $ 2,228 $ 24 $ 2,252
Gross cash collateral received $ 5,318
Netting agreements and market value adjustments $ (4,660)
Nontrading derivatives and other financial liabilities measured
on a recurring basis $ — $ 2,228 $ 24 $ 7,570 $ (4,660) $ 2,910
Total liabilities $ 58,137 $1,250,013 $ 20,448 $1,380,749 $(1,113,572) $267,177
Total as a percentage of gross liabilities (4) 4.4% 94.1% 1.5% 100.0%
(1) For the year ended December 31, 2012, the Company transferred assets of $1.7 billion from Level 1 to Level 2, primarily related to foreign government bonds, which were not traded with enough frequency to
constitute an active market. During the year ended December 31, 2012, the Company transferred assets of $1.2 billion from Level 2 to Level 1 primarily related to foreign government bonds, which were traded
with sufficient frequency to constitute an active market. During the year ended December 31, 2012, the Company transferred liabilities of $70 million, from Level 1 to Level 2, and liabilities of $150 million from
Level 2 to Level 1.
(2) Represents netting of: (i) the amounts due under securities purchased under agreements to resell and the amounts owed under securities sold under agreements to repurchase; and (ii) derivative exposures covered by
a qualifying master netting agreement, cash collateral and the market value adjustment.
(3) There is no allowance for loan losses recorded for loans reported at fair value.
(4) Percentage is calculated based on total assets and liabilities measured at fair value on a recurring basis, excluding collateral paid/received on derivatives.